Blog Post: Day 6 of $QQQ short term down-trend; GMI=0; Gold ($GLD) has been one of the best places to take cover from the market’s weakness, see daily charts of RWB pattern and blue dot indicator..
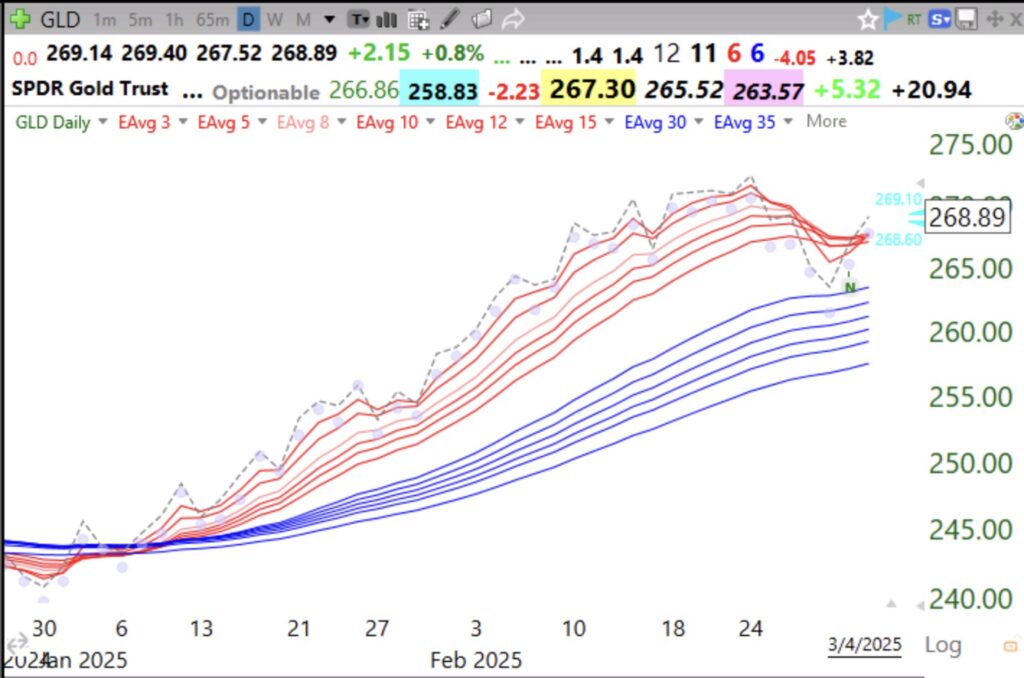
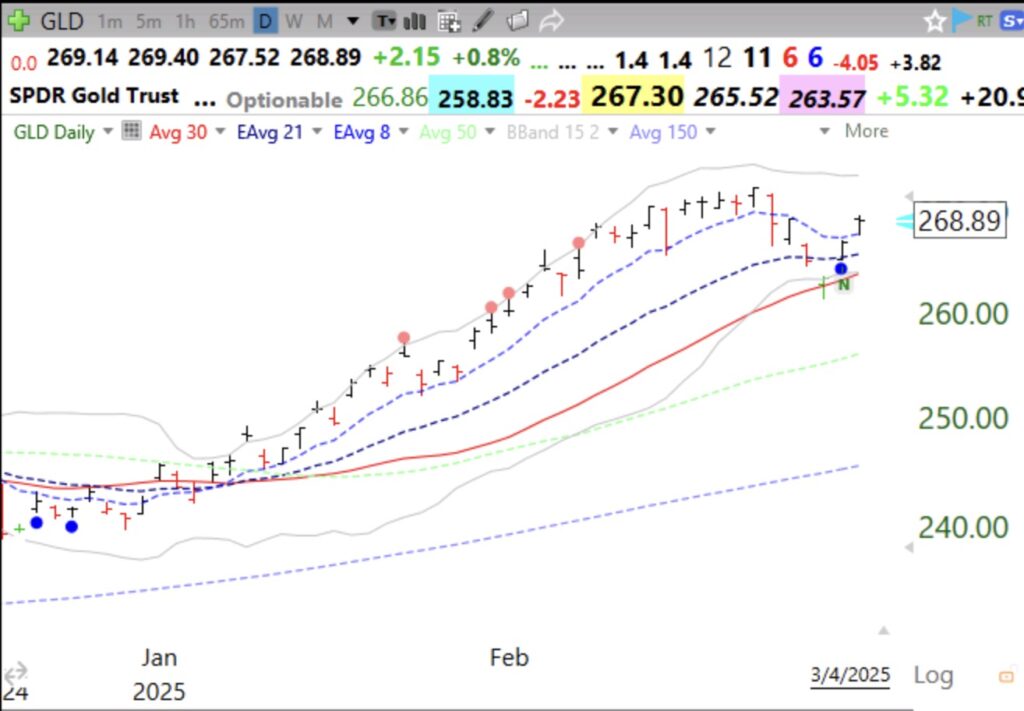
All of the shorter term averages (red) are rising above the longer term averages (blue) in a RWB up-trend. The daily closes are shown by the dotted line. Note the oversold bounce marked by a blue dot in the second daily chart. I plan to explain my blue dot indicator in my presentation at the Boston IBD Meetup online in May. More details about this meeting in a future post.
Related
Source link