Blog Post: Day 76 of $QQQ short term up-trend; 255 US stocks at yearly highs, 87 at ATHs and 18 at new lows; $RDDT had a GLB, see daily and weekly charts.
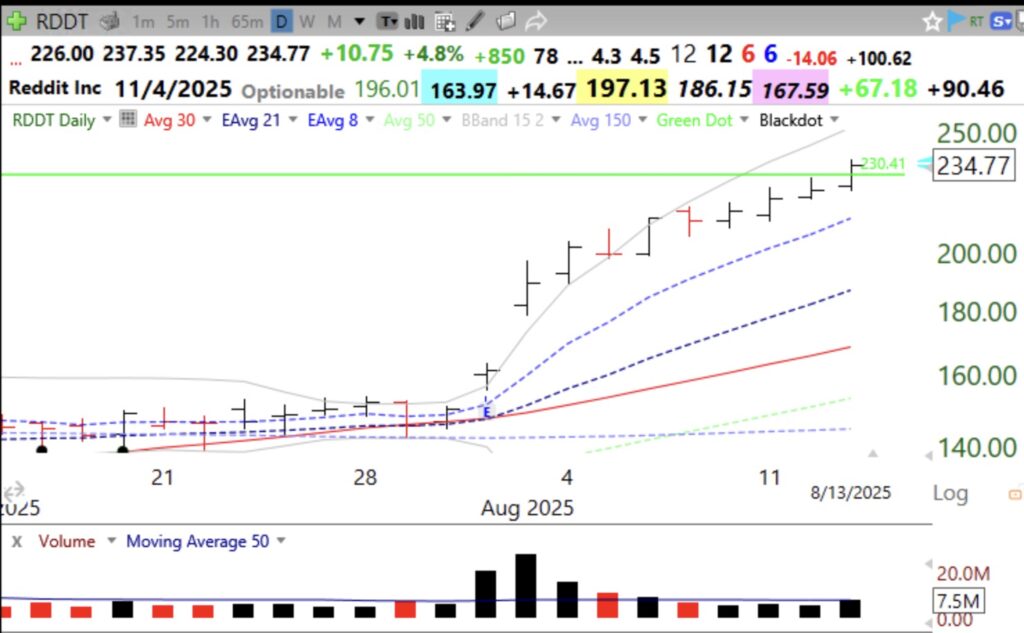
Daily chart. RDDT began ths rise with a gap up after earnings. I would like to see more volume on today’s GLB. A CLOSE below the green line at 230.41 would be a failed GLB.
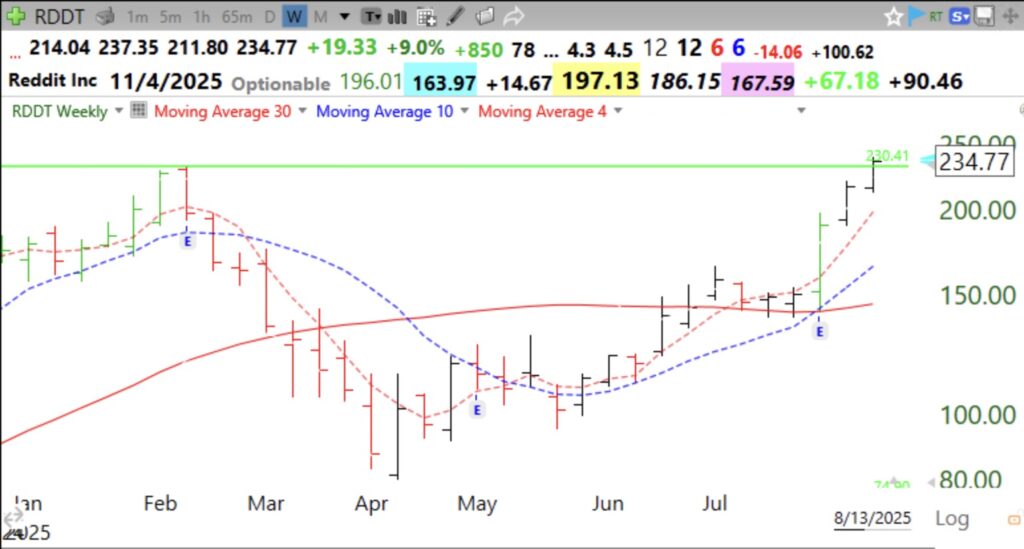
Weekly chart. Note moves after each quarterly earnings report is released.
Related
Source link