Break-Even Iron Condor Options Strategy
Previously, we discussed the iron condor option strategy and the traditional way it is traded and adjusted.
Today, we are going to talk about an alternate iron condor strategy that is traded quite differently from the traditional methods.
This is the break-even iron condor (BEIC) strategy that some zero-DTE traders use.
However, the core central concept remains the same regardless of whether it is an intraday strategy or a longer-term strategy.
The time till expiration that the trader chooses will depend on their availability to be in front of the computer.
Trading it at zero-DTE means you are basically at your computer all day.
In our examples, we will use expirations about two weeks away, with the trader able to check the trade maybe once in the morning session and once in the afternoon session.
Contents
There are many variations of this strategy, and traders often add their own personal touches and styles to it.
The main goal here is to understand the central idea behind the break-even iron condor.
It should be assumed that the reader is already familiar with put credit spreads and call credit spreads.
The key term here is “break-even”, which reflects the trader’s mindset: they would rather end the trade flat than take a loss.
In other words, they prefer making nothing over losing something.
Similar to a traditional iron condor, we sell an out-of-the-money put spread and an out-of-the-money call spread.
The widths of the two spreads don’t have to be identical, though ideally we aim to collect a similar amount of credit on both sides.
In this example, we’ll trade the strategy on XSP, the S&P 500 Mini SPX options index.
It is one-tenth the size of SPX.
It is important that XSP is cash-settled because we don’t want to risk being assigned shares of stock or an ETF – especially since this strategy requires us to hold the position until expiration (which is quite different from how a typical iron condor is usually traded).
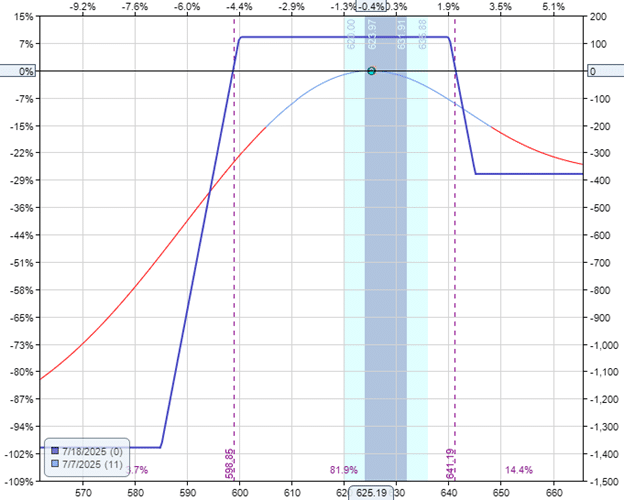
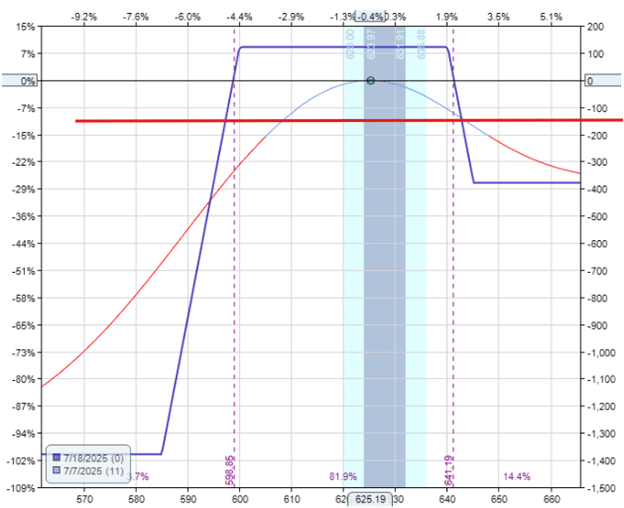
Date: July 7th, 2025
Price: XSP @ $625.19
Bull put spread:
Buy one contract July 18 XSP 585 put @ $0.48
Sell one contract July 18 XSP 600 put @ $1.07
Credit: $59
Bear call spread:
Sell one contract July 18 XSP 640 call @ $1.07
Buy one contract July 18 XSP 645 call @ $0.45
Credit: $62
We are selling the short put option with a delta of around 12 on the option chain.
The long put option is around the six delta.
This gave us a credit of about $59 for the put spread.
We adjusted the width of the call spread to give a similar credit.
In this case, a credit of $62.
Let’s say the credit for each spread is around $60, and the maximum potential profit per spread is $60.
Hence, we ended up with an unbalanced iron condor because the two spreads had different widths.
The two spreads will be managed independently.
Each spread has its own stop loss exit level, set at a 1x loss limit.
This means that if a spread has a maximum potential profit of $60, we don’t want to risk losing more than that same amount if the spread loses.
Therefore, if it costs us more than $120 to buy back the spread, that will trigger the stop loss exit.
Said differently, we don’t want to buy back to close a spread for more than twice the credit received for that spread.
Buying it back at $120 to close a spread means that we have given back the original $60 credit and paid another $60, resulting in a $60 net loss on that spread.
Another way to look at it…
If the net initial credit for the whole iron condor is $120, we therefore, we don’t want to have to pay more than that amount to close one of the spreads.
The above risk graph of the unbalanced condor shows a risk-to-reward of 11-to-1 for this iron condor.
Max risk $1378 / Max reward $121 = 11.4
However, when stops are honored, the reward-to-risk ratio will change.
With the 1x stop in place, the spread has the potential to lose $60 if the stop is triggered.
If held to expiration without being challenged, it has the potential to earn the initial credit of $60.
The risk-to-reward of the spread becomes 1-to-1.
If both spreads had been stopped out, we would have lost $120 in total.
The iron condor, in total, has the potential to make $120.
Therefore, the iron condor risk-to-reward is also 1-to-1 when stops are in place.
I have marked a horizontal red line in the risk graph below to indicate where the stops would cap the risk on this trade, provided the stops are executed at their intended stop exit level (which they may not, as we shall see).
The best-case scenario for this trade is that the underlying price stays within a range so that neither spread is stopped out.
It turns out that over the 11-day duration of this trade, neither spread exceeded the value of $120.
So the trade ran to expiration; both spreads expired worthless, and we kept the initial credit on both.
Net profit in trade is $121.
With a margin usage of $1378, that would be an 8.8% return on margin.
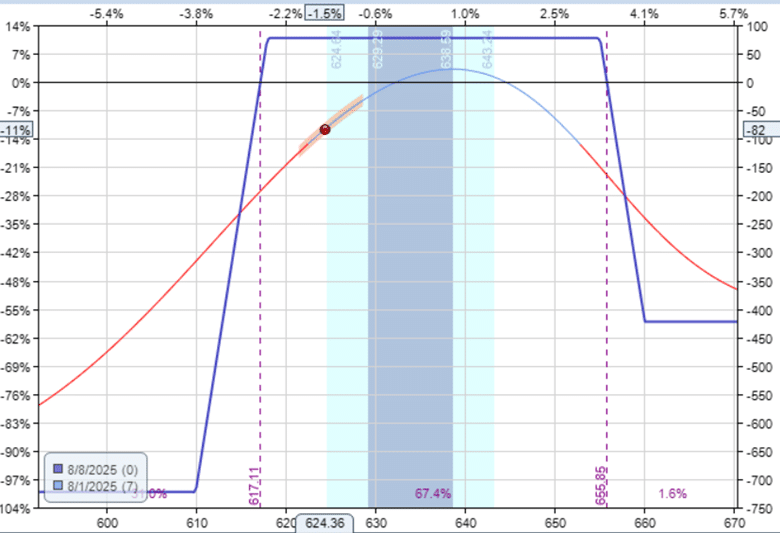
The following example will explain why this strategy is called the break-even iron condor.
Date: July 28, 2025
Price: XSP @ $639.87
Bull put spread:
Buy one contract Aug 8 XSP 610 put @ $0.50
Sell one contract Aug 8 XSP 618 put @ $0.87
Credit: $37
Bear call spread:
Buy one contract Aug 8 XSP 660 call @ $0.26
Sell one contract Aug 8 XSP 655 call @ $0.67
Credit: $41
Since we collected about $40 per spread, the stop loss exit level is when the spread gets to $80.
We don’t want to have to buy back the spread for more than $80.
If we had to buy it back at a price above $80, we could not break even on the trade.
The trade would be at a loss because the total initial credit we received for the iron condor is $78, and we can not make more than that.
On the morning of August 1st, the trader checked and saw that the price of the put spread had risen to $159, $79 above the stop-exit level of $80.
In the previous afternoon’s check, the trade was still fine.
This is because the XSP made a large gap down overnight.
Per the rule, the trader exits the put spread.
Date: Aug 1, 2025
Price: XSP @ $624.36
Sell to close one contract Aug 8 XSP 610 put @ $2.35
Buy to close one contract Aug 8 XSP 618 put @ $3.94
Debit: -$159
The remaining call spread is held to expiration and expired worthless.
And in most cases (but not all), when one of the spreads is stopped out, the remaining spread can win its maximum profit without hitting its stop loss.
And this is the case in this example.
So the net P&L of the entire trade is -$81.
Initial credit for put spread: $37
Initial credit for call spread: $41
Exit of the put spread: -$159
Call spread expires: $0
Net P&L in trade: -$81
In theory, it would have been break-even if we were able to exit exactly at the stop exit price of $80 instead of $159.
This is why it is called the “break-even” strategy.
The stop exit is set such that if that spread loses, it loses by the same amount that the other spread would profit.
In practice, we lose a little more on the trade due to slippage, fees, commissions, and gaps past the exit price.
Many traders of this strategy like to use it as a zero-DTE strategy to avoid the overnight gaps that go past their stop exit level.
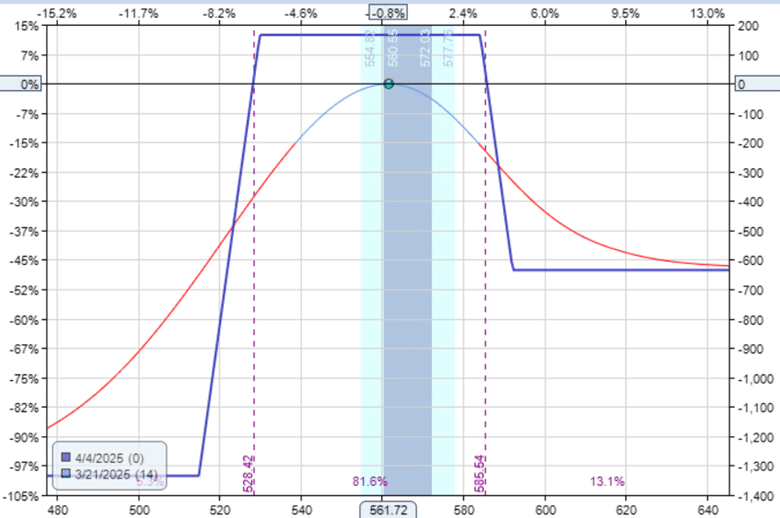
It is important to understand the worst-case scenario in any strategy.
Here is a case in point…
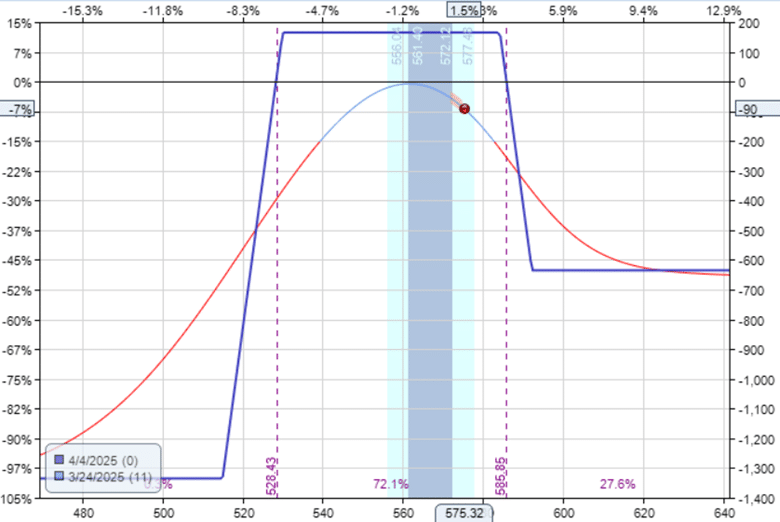
Date: March 21, 2025
Price: XSP @ $561.72
Bull put spread:
Buy one contract Apr 4 XSP $515 put @ $0.64
Sell one contract Apr 4 XSP $530 put @ $1.48
Credit: $84
Bear call spread:
Buy one contract Apr 4 XSP $592 call @ $0.32
Sell one contract Apr 4 XSP $584 call @ $1.14
Credit: $82
We don’t want to pay more than $160 (twice the credit of $80) to exit a spread.
If the price of the spread gets near $160, we exit the spread.
Three days into the trade on Monday morning, March 24th, the market had an over-the-weekend gap up.
The price to close the call spread is $236 (way past the exit point of $160).
The trader manually exits the call spread as soon as he sees this.
Date: March 24, 2025
Price: XSP @ $575.32
Buy to close one Apr 4 XSP $584 call @ $3.61
Sell to close one Apr 4 XSP $592 call @ $1.26
Debit: -$235
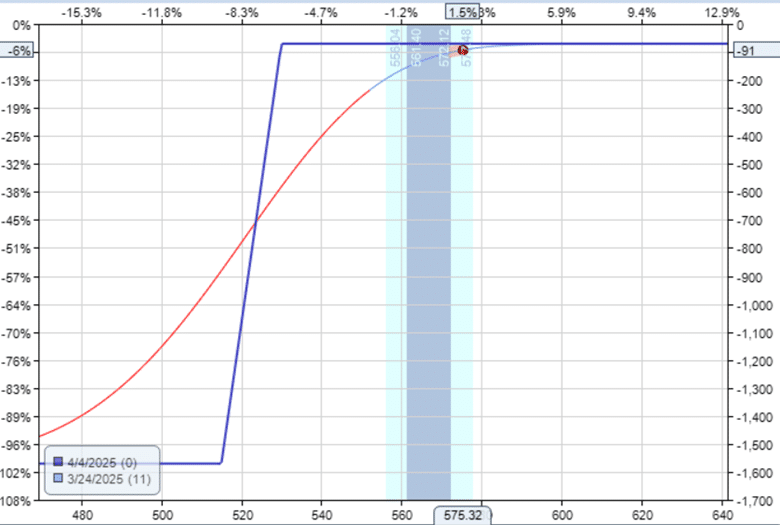
The resulting position is:
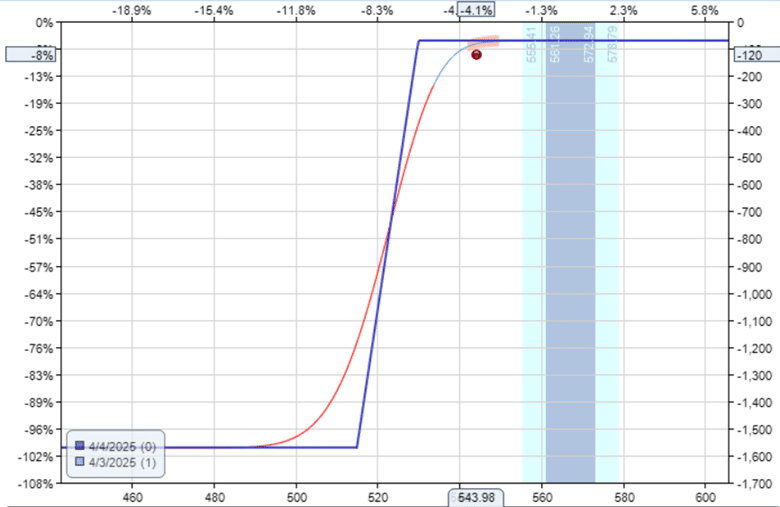
About one day before expiration, on the afternoon of April 3, the position still looks fine and has not yet reached the stop loss for the put spread.
But the next morning, on April 4th, the market gapped down, and the position gapped way past the stop loss.
Closing the spread now costs $855 (definitely way past the stop-loss limit of exiting at a debit of $160).
The trader closes the spread to exit the position.
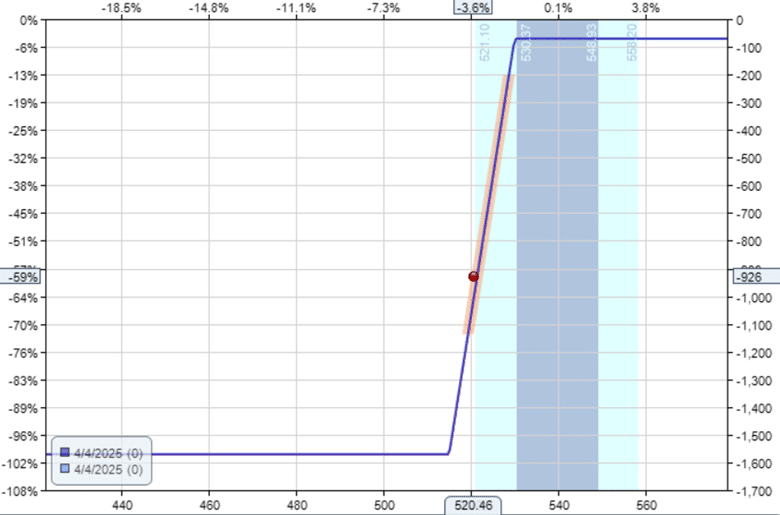
The large market drop, coupled with an increase in implied volatility and being so close to expiration on expiration day, resulted in a net loss of -$926 on the trade.
Double stop-outs like this, where the price moves to take out one spread and then whipsaws to take out the other spread, are rare (perhaps around 5% of the time), but they do happen.
If there hadn’t been an overnight gap in the price and we had exited at our stop-loss level, then our maximum loss in the trade should, in theory, have been around $160.
For example:
Bull put spread credit: $84
Bear call spread credit: $82
If we had been able to close the bear call spread at stop: -$160
If we had been able to close the bull put spread at stop: -$160
Net P&L would have been: -$154.
The position lost about $800 from the afternoon of the day before to the morning of the next day.
This is how fast the P&L can change on or near expiration day.
Many traders also use automated buy stop-limit exit orders so their spreads can close as soon as the exit price is triggered, without them needing to be at the computer.
Even so, there are times in a fast-moving market that a limit order does not fill (especially if the limit price is set too close to the trigger price).
Some will combine this order with an additional backup order that exits at market price via an OCO (one-cancels-another) advanced order type.
As with any strategy, you need to test it out yourself.
The three outcomes of this trade are:
- The winning scenario where both spreads expire worthless.
- The break-even scenario where one of the spreads is stopped out and the other spread wins.
- The double stop-out scenario where both spreads are stopped out.
In theory, the break-even point is neither a win nor a loss.
The double stop-out scenario will lose just as much as the winning scenario would win.
The expectation is that double stop-outs occur less frequently than winning scenarios, so this strategy should have a positive expectancy.
In reality, due to slippage and not being able to exit at the stop exit price, the break-even scenario usually results in a slight loss in the trade.
Nevertheless, depending on market conditions, it is hoped that the winning scenario occurs often enough to cover these losses.
Hence, some traders report that this strategy has more losses than wins, but the wins are larger than the losses, so that it has overall positive returns in the long run.
See Tammy Cambless and John Sandvand’s experiences with this strategy traded in zero-DTE.
The break-even iron condor may not follow the traditional way most traders manage an iron condor.
Still, it offers a practical approach for those who prioritize capital preservation over profit maximization.
By treating each side of the trade independently and maintaining strict 1x stops, the trader aims to protect against large losses while still allowing for potential gains when the market remains within range.
Whether traded as a zero DTE setup or with more days to expiration, the goal isn’t to hit home runs, but to stay in the game.
We hope you enjoyed this article on the break-even iron condor options strategy.
If you have any questions, please send an email or leave a comment below.
Trade safe!
Disclaimer: The information above is for educational purposes only and should not be treated as investment advice. The strategy presented would not be suitable for investors who are not familiar with exchange traded options. Any readers interested in this strategy should do their own research and seek advice from a licensed financial adviser.

Source link