Bullish Surge! This Stock’s Uptrend Is Just Getting Started!

BigBear.ai Secures Key U.S. Navy Contract
BigBear.ai Holdings, Inc. (NYSEThe New York Stock Exchange (NYSE) is a global financial powerhouse, and at the heart of its performance measurement stands the NYSE Composite Index (NYA). This comprehensive index…: BBAI) experienced a significant surge in its stock price following the announcement of a major contract win. The company has been awarded a prime Indefinite Delivery/Indefinite Quantity (IDIQ) contract under the U.S. Department of Navy’s SeaPort Next Generation program. This development marks a crucial milestone in BigBear.ai’s expansion into national security and defense technology.
This contract allows BigBear.ai to provide advanced AI-powered solutions to the U.S. Navy and other federal agencies, reinforcing its role in military modernization efforts. The scope of the agreement includes:
- Systems engineering and AI-driven process optimization
- Development of specialized technology solutions for naval operations
- Strengthened presence in defense initiatives and national security applications
This contract positions BigBear.ai as a key player in the growing AI-driven defense sector, an industry that continues to attract significant government investment.
Stock Performance Reflects Growing Investor Confidence
Following the contract announcement, BigBear.ai’s stock saw a sharp increase:
- Shares climbed 13.19%, reaching $4.12 per share
- The stock hit an intraday high of $4.30 and a low of $3.85
- Trading volume surged, with 45.8 million shares changing hands, far exceeding the daily average of 34.8 million
The heightened trading activity suggests strong investor interest and confidence in the company’s potential to secure additional government contracts and expand its AI solutions business.
Analyst Upgrades Drive Further MomentumMomentum in stock trading refers to the rate of acceleration of a stock’s price or trading volume. It indicates the strength of a trend and measures how quickly prices are rising o…
Analyst sentiment surrounding BigBear.ai has turned increasingly bullish, further propelling the stock upward.
- HC Wainwright raised its price target from $3.00 to $7.00, maintaining a “buy” rating.
- Cantor Fitzgerald reaffirmed an “overweight” rating, setting a price target of $3.50.
These upgrades indicate that analysts recognize BigBear.ai’s growth potential, particularly given its strategic positioning in AI-driven defense and security solutions.
Why Investors Should Watch BigBear.ai
BigBear.ai is carving out a significant niche in the AI-powered national security and defense market. Several factors make this company particularly important for investors to follow:
- Government Contracts as a Revenue Driver – Securing federal contracts, particularly with the Department of Defense, provides BigBear.ai with a stable and lucrative revenue stream. The government’s increasing reliance on AI solutions for defense applications underscores the company’s long-term growth potential.
- Expansion in AI for National Security – With rising geopolitical tensions, the demand for advanced AI in defense intelligence and operations continues to grow. BigBear.ai is positioning itself as a leader in this space, competing with other major defense contractors.
- Strong Analyst Sentiment – Positive ratings and price target increases suggest that institutional investors and analysts see BigBear.ai as an undervalued opportunity with strong growth potential.
- Leadership Reinforcement – The recent appointment of Kevin McAleenan, former Acting Secretary of Homeland Security, as CEO (effective January 2025) signals a strategic push toward deeper government integration. His experience in homeland security may help the company secure additional high-profile contracts.
BBAI Trading Plan
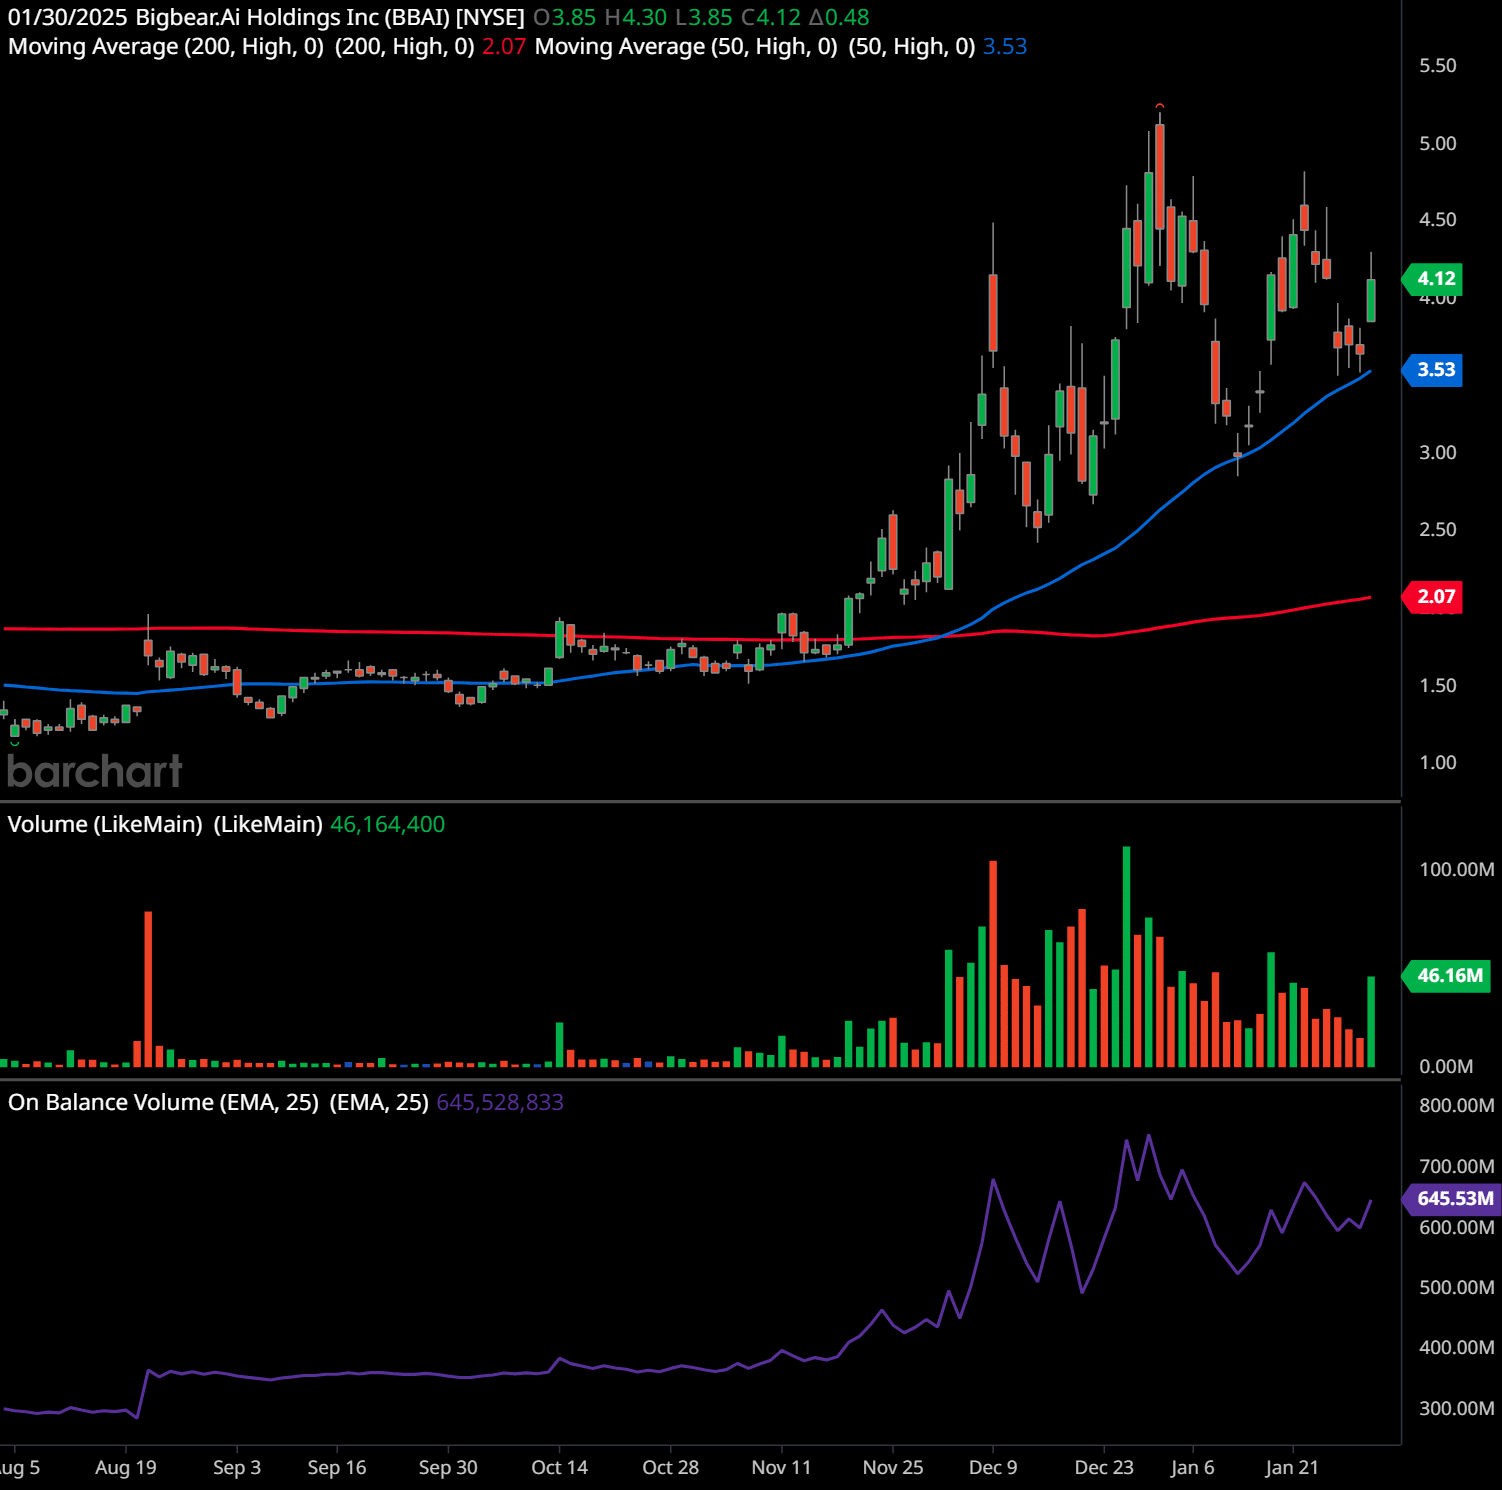
The chart of BigBear.Ai Holdings Inc (BBAI) in the daily timeframe demonstrates significant price activity and technical indicators that provide a detailed picture of its current trend, trader sentiment, and potential future movements.
Trend Analysis
The stock shows a strong upward trend since mid-November 2024, supported by a breakoutBreakout patterns occur when a stock price moves beyond a defined level of support or resistance with increased volume, signaling the potential start of a new trend. A breakout ind… above the 50-day moving averageThe concept of moving averages dates back to the early 20th century. While it is challenging to attribute the invention of moving averages to a single individual, W. P. Hamilton, a… (currently at $3.53) and the 200-day moving averageThe concept of moving averages dates back to the early 20th century. While it is challenging to attribute the invention of moving averages to a single individual, W. P. Hamilton, a… (at $2.07). The recent pullback appears to be finding support at the 50-day moving averageThe concept of moving averages dates back to the early 20th century. While it is challenging to attribute the invention of moving averages to a single individual, W. P. Hamilton, a…, a healthy sign within an ongoing uptrend. Additionally, the On Balance VolumeThe On Balance Volume indicator (OBV) is a technical analysis tool used to measure the flow of money into and out of a security over a specified period of time. It is a cumulative … (OBVThe On Balance Volume indicator (OBV) is a technical analysis tool used to measure the flow of money into and out of a security over a specified period of time. It is a cumulative …) indicator is rising sharply, indicating strong accumulation by market participants. Volume levels have surged during price increases, confirming bullish momentumMomentum in stock trading refers to the rate of acceleration of a stock’s price or trading volume. It indicates the strength of a trend and measures how quickly prices are rising o….
Support and Resistance Levels
Key support levels:
- Immediate support at $3.53 (50-day moving averageThe concept of moving averages dates back to the early 20th century. While it is challenging to attribute the invention of moving averages to a single individual, W. P. Hamilton, a…).
- Stronger support at $2.50, a previous breakoutBreakout patterns occur when a stock price moves beyond a defined level of support or resistance with increased volume, signaling the potential start of a new trend. A breakout ind… point and psychological level.
- Critical long-term support at $2.07 (200-day moving averageThe concept of moving averages dates back to the early 20th century. While it is challenging to attribute the invention of moving averages to a single individual, W. P. Hamilton, a…).
Key resistance levels:
- Immediate resistance at $4.30 (recent intraday high).
- Major resistance around $5.00, a key psychological level and past rejection point.
Chart PatternsChart patterns are visual formations on price charts that occur due to the behavior of buyers and sellers in the market. These patterns often signal potential future price movement… and Trader PsychologyTrader psychology refers to the emotions and mental states that influence a trader’s decision-making process in financial markets. Emotions such as fear, greed, hope, and regret …
The chart displays a “flag pattern” following the sharp rally from $2.50 to $5.00 in December. This pattern suggests a consolidation phase, where short-term traders lock in profits while long-term investors maintain confidence in further upside. The breakoutBreakout patterns occur when a stock price moves beyond a defined level of support or resistance with increased volume, signaling the potential start of a new trend. A breakout ind… above $4.12 (current closing price) suggests renewed momentumMomentum in stock trading refers to the rate of acceleration of a stock’s price or trading volume. It indicates the strength of a trend and measures how quickly prices are rising o…, potentially leading to a retest of $5.00 or higher.
Indicators and Psychology
- The 50-day moving averageThe concept of moving averages dates back to the early 20th century. While it is challenging to attribute the invention of moving averages to a single individual, W. P. Hamilton, a… is trendingUnderstanding market trends is a critical component for businesses conducting industry analysis. For example, Netflix identified early on the growing demand for streaming services … upward, signaling a short-term bullish outlook.
- The 200-day moving averageThe concept of moving averages dates back to the early 20th century. While it is challenging to attribute the invention of moving averages to a single individual, W. P. Hamilton, a… remains flat but could turn upward if the rally persists, reinforcing the long-term bullish sentiment.
- OBV’s continued rise indicates aggressive buying, suggesting strong conviction from market participants.
Price Forecast
Short-term: The stock may continue its upward trajectory, targeting $4.50 and $5.00 if it holds above $4.12. A breakoutBreakout patterns occur when a stock price moves beyond a defined level of support or resistance with increased volume, signaling the potential start of a new trend. A breakout ind… above $5.00 could attract further momentumMomentum in stock trading refers to the rate of acceleration of a stock’s price or trading volume. It indicates the strength of a trend and measures how quickly prices are rising o… traders.
Medium-term: As long as the stock remains above $3.53 (50-day moving averageThe concept of moving averages dates back to the early 20th century. While it is challenging to attribute the invention of moving averages to a single individual, W. P. Hamilton, a…), the bullish trend is intact, and it could target $6.00 or higher.
Long-term: Sustained volume and buying pressure could propel the stock further if it maintains its position above the 200-day moving averageThe concept of moving averages dates back to the early 20th century. While it is challenging to attribute the invention of moving averages to a single individual, W. P. Hamilton, a….
Trading Plans
Swing TradingSwing trading is a popular trading strategy aimed at capturing short- to medium-term gains by taking advantage of price swings in financial markets. Unlike day trading, which invol… Plan:
- Buy entry: $4.12 (current price) or on a pullback to $3.60 (50-day MA).
- Stop loss: $3.45 (below the 50-day MA).
- Profit targets: $4.50, $5.00.
Long-term Trading Plan:
- Buy entry: Accumulate between $3.50 and $4.00 during consolidations.
- Stop loss: Close below $2.00 (200-day MA).
- Profit targets: $6.00, $7.50, and beyond if the bullish trend persists.
Past performance is not an indication of future results. This analysis is not investment advice. Always conduct your own research and consult a financial advisor before making any investment decisions. 🧡
Looking Ahead
BigBear.ai’s stock rally reflects growing confidence in its strategic direction and ability to capitalize on AI-driven defense solutions. With a significant government contract win, strong analyst endorsements, and a leadership team with deep government ties, the company is well-positioned for long-term growth. Investors looking for exposure to AI applications in national security should closely monitor BigBear.ai’s progress, as its trajectory suggests further opportunities for expansion and increased market valuation.
Lance Jepsen is the senior personal finance writer for Guerilla Stock Trading who has spent more than 25 years covering the stock market and economics. In addition, Lance has worked as a private stock analyst for a number of high worth individuals.
Do you have a news tip for GuerillaStockTrading? Please email us at [email protected]
🗨️ JOIN OUR COMMUNITY OF STOCK TRADERS AND INVESTORS ON SOCIAL MEDIA
💥 GET OUR LATEST CONTENT IN YOUR RSS FEED READER
We are entirely supported by readers like you. Thank you.🧡
At GuerillaStockTrading, we maintain full transparency and impartiality; we never blog about stocks or crypto in which we hold a personal position unless explicitly stated in the article. Additionally, we do not accept paid promotions presented as content. All information shared is for informational purposes only and should not be construed as financial, investment, tax, or legal advice, nor as a recommendation to buy any security or financial asset. The content is general in nature and does not account for individual circumstances. It may not be suitable for your particular situation. Before making financial decisions, you are encouraged to seek guidance from your own financial or investment advisor.
Trading and Investment Ideas:
Source link