Candlestick Indicators Explained: How To Read & Interpret Them | Trading Strategy Guides
A candlestick indicator serves as powerful tools for analyzing market trends and price movements. Candlestick analysis helps traders interpret market sentiment by displaying price action through distinct patterns and formations. Experienced traders rely on these candlestick patterns to develop their trading strategies based on chart reading of the price action.
Traditional technical analysis combines chart patterns with other technical indicators to enhance trading accuracy and have better trade entries. These trading tools, when used together, create a comprehensive framework for reading the market psychology. This guide reveals which specific technical indicators pair best with each candlestick formation for maximum trading effectiveness.
The most powerful candlestick-indicator combinations include:
- Doji formations with RSI
- Hammer patterns with MACD
- Morning star with Stochastic Oscillator
- Evening star with On-Balance Volume
- Bullish engulfing with ADX
- Bearish engulfing with Bollinger Bands
- Three white soldiers with Volume Profile
Focus on mastering a select few candlestick patterns and focus on mastering these proven pattern-indicator combinations rather than trying to learn every possible price action formation immediately. Understanding how the candlestick indicator works in different market conditions will improve your ability to spot profitable trading opportunities.
What is a Candlestick Indicator?
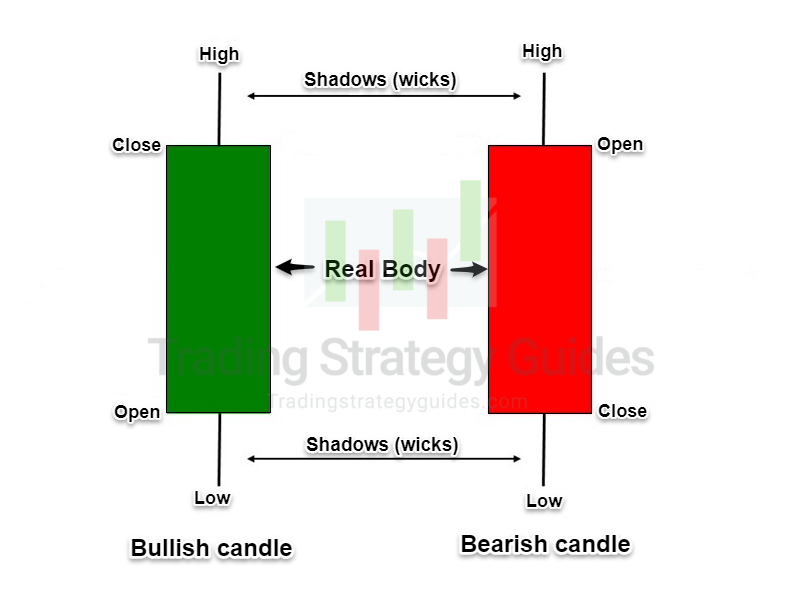
A candlestick indicator is a visual representation of price action during a specific trading timeframe. Candlestick indicators form the foundation of advanced technical analysis, allowing traders to decode market psychology through distinctive pattern recognition. This guide examines candlestick patterns on various timeframes, where each formation signals potential trading opportunities. A candlestick has three essential components:
- The body: which shows the trading range’s volatility or the open-close range. A green body signals bullish momentum (close > open), while red indicates bearish pressure (close
- The wicks: that display the highest and lowest price points
- The color: a bullish pattern suggests upward momentum, while bearish patterns indicate downward pressure
Through practice, multiple candlesticks combine to create recognizable patterns that signal potential trend reversals or continuations. There are numerous powerful candlestick formations available to technical traders – some help determine the strength of current market trends, while others predict potential breakouts or market consolidation periods.
2 Bullish Candlestick Patterns
Bullish candlestick patterns are powerful trading signals that emerge after price declines, suggesting potential profitable trading opportunities. These formations provide traders with key insights to initiate strategic long positions when paired with specific technical indicators.
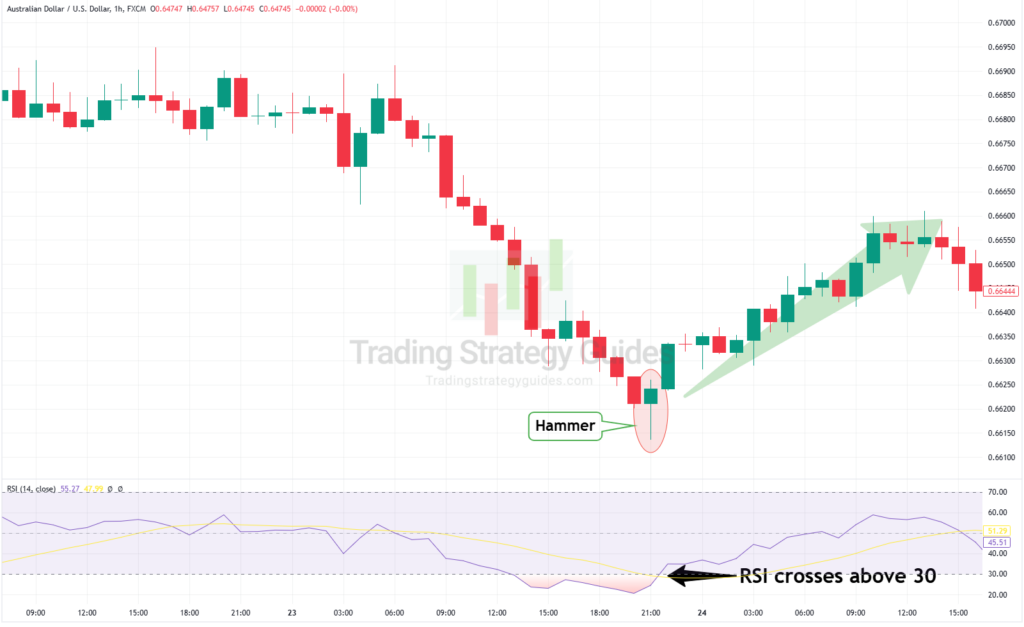
Hammer with RSI Indicator
The hammer pattern appears as a small body candle with an extended lower wick, typically forming near a downtrend’s bottom. According to trading rules, the lower wick should extend at least double the length of the real body.
A hammer indicates that despite intense selling pressure initially driving prices down, strong buying momentum eventually pushed prices higher. While both green and red hammers are valid, a green hammer combined with oversold RSI readings below 30 provides the strongest entry signals.
For optimal trading results, wait for the following day’s candle to close bullish while RSI moves above 30.
Why It Works: The Hammer’s rejection of lower prices aligns with RSI’s oversold bounce, creating a confluence of buyer momentum.
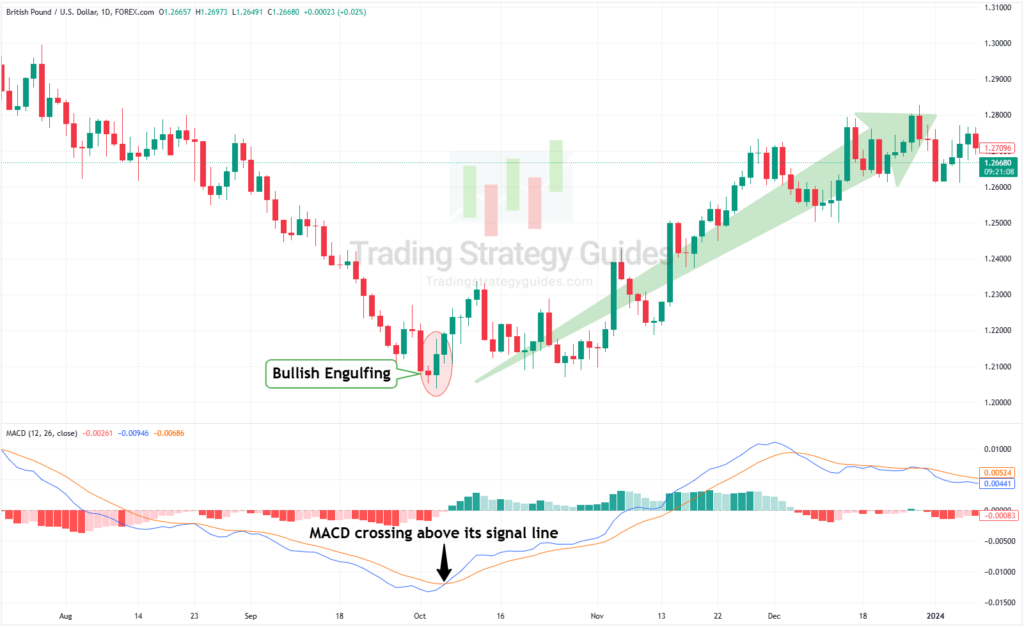
Bullish Engulfing with MACD
The bullish engulfing setup requires two consecutive candlesticks paired with MACD crossing above its signal line. The initial red candle followed by a larger green candle creates this pattern, while MACD confirms momentum.
When price opens below support but closes significantly higher, coupled with a bullish MACD crossover, this pattern signals strong buying pressure.
Why It Works: Sellers lose control as bulls overpower the session, validated by MACD’s trend-following strength.
2 Bearish Candlestick Patterns
Bearish candlestick formations typically emerge following sustained upward trends, indicating potential reversal zones. When combined with specific technical indicators, these patterns give traders confidence to exit long positions and potentially profit from downward price movements.
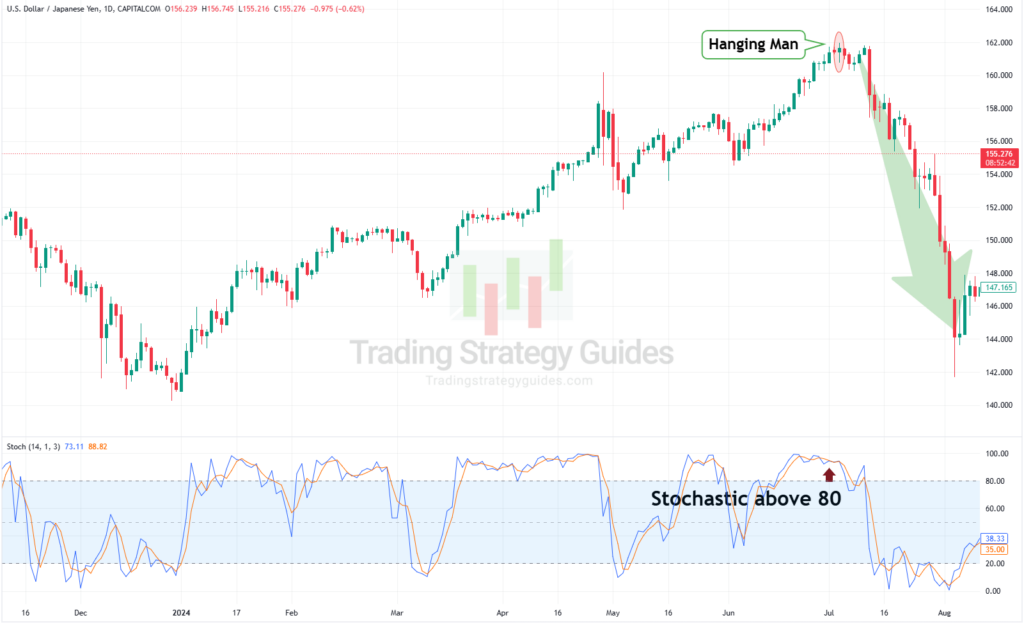
Hanging Man with Stochastic Oscillator
The hanging man resembles the hammer’s structure but appears near the peak of bullish trends, particularly powerful when stochastic shows overbought conditions. Similar to other reversal chart patterns, the lower shadow should extend at least twice the body’s length.
This pattern suggests that despite aggressive selling during the session, buyers temporarily maintained control, but when combined with stochastic readings above 80, it strongly signals weakening bullish momentum.
Why It Works: The long lower wick shows sellers testing support, while overbought Stochastic hints at reversal readiness.
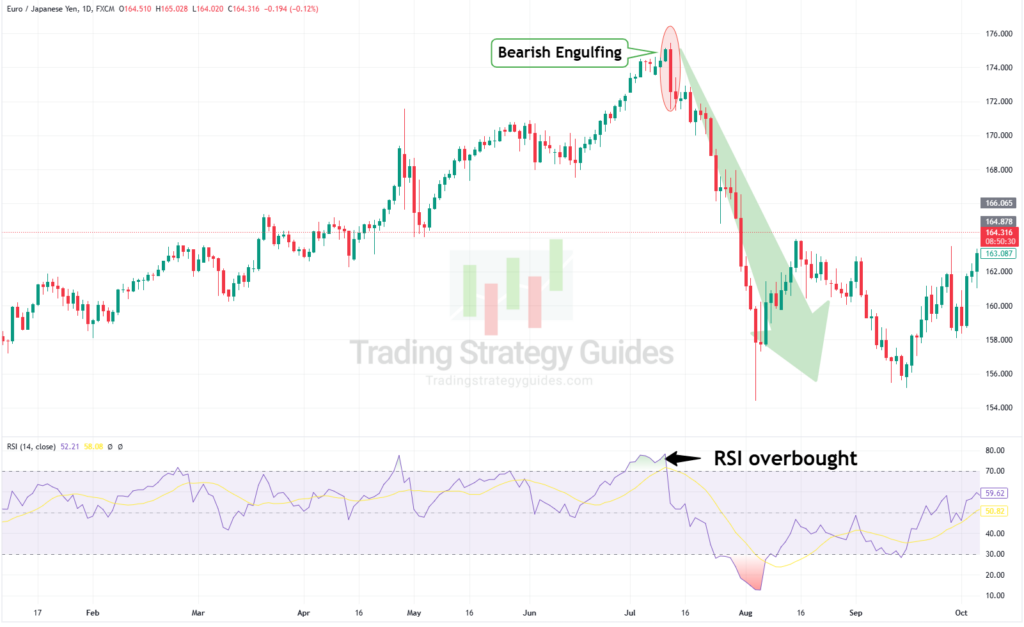
Bearish Engulfing with RSI
A bearish engulfing pattern becomes especially powerful when confirmed by overbought RSI readings. The pattern shows a small bullish candle completely enveloped by a larger subsequent bearish candle.
When combined with an RSI above seventy, this setup warns traders of potential trend exhaustion ahead. The stronger the RSI overbought reading appears alongside the engulfing pattern; the higher probability of reversal exists.
Why It Works: The pattern’s aggressive selling aligns with RSI’s overbought warning, highlighting profit-taking phases.
2 Continuation Candlestick Patterns
While many traders focus solely on dramatic price swings, continuation patterns reveal crucial consolidation phases in market movement. These patterns offer valuable insights into potential energy building periods, especially when markets appear to be taking a breather before their next move.
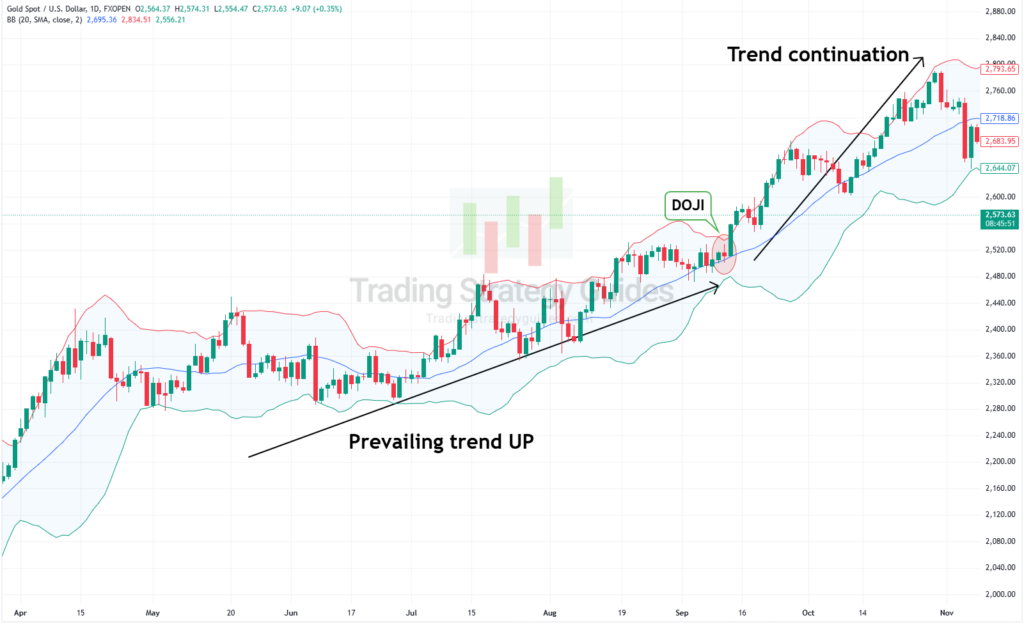
Doji with Bollinger Bands
When a doji forms near the middle Bollinger Band while price action remains contained within the bands, it often signals market equilibrium – traders should watch for this neutral formation accompanied by decreasing volatility and band contraction.
This powerful combination demonstrates temporary balance between buying and selling pressure within the Bollinger Bands framework. While a standalone doji suggests indecision, placing it in context of Bollinger Band squeeze can signal impending volatility expansion and potential breakout opportunities.
Why It Works: Bollinger Bands quantify volatility, while the Doji flags trader indecision – ideal for anticipating explosive moves.
Spinning top with ATR
A spinning top appearing during periods of declining ATR reveals a unique market psychology worth noting. The pattern suggests a temporary standoff between market participants, with neither buyers nor sellers gaining ground: when volatility drops, price often coils tighter before its next move. Traders frequently observe these spinning tops with falling ATR as potential energy building phases, particularly when markets transition between trending and ranging conditions.
When combined with an unusually low ATR reading, the spinning top becomes a powerful signal, as it often precedes explosive moves once the period of compressed volatility finally resolves itself.
Why It Works: Low volatility periods (coiling) typically resolve into high-momentum moves, captured by ATR’s volatility measure.
Remember that no candlestick indicator works perfectly every time so start by focusing on just 2-3 pattern-indicator combinations that resonate with your trading style.
Source link