Comparison Of Double Options Structures
In today’s article, we’ll be exploring double structure option setups.
We’ll begin with the most familiar example, the double calendar, then move on to the double butterfly, and finally discuss a hybrid double configuration that combines one butterfly with one calendar.
By the end of this article, you’ll understand the differences among these three setups and when each is best used.
All of them are non-directional trades, which means we ideally want the underlying price to stay near its current level rather than move sharply in either direction.
The benefit of the double structure is that it provides a wide zone within which the price can move while still keeping the position profitable.
Let’s take a look at the three key option Greeks: theta, delta, and vega.
We know that in all of these setups, theta is positive, meaning the trade earns income over time as the options we sell decay faster than the ones we buy.
Since these strategies are relatively delta-neutral, the main difference between these structures then becomes vega.
Contents
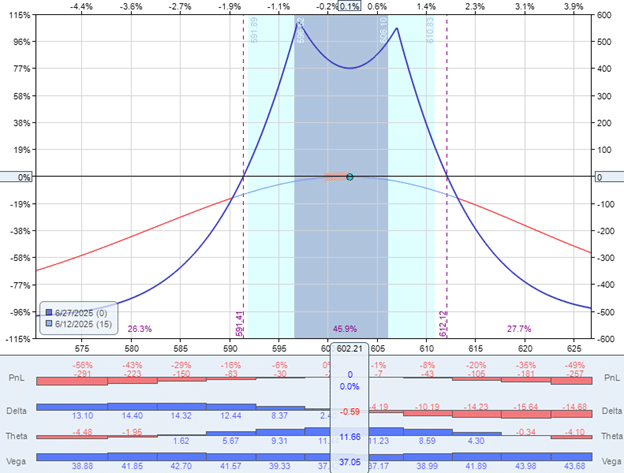
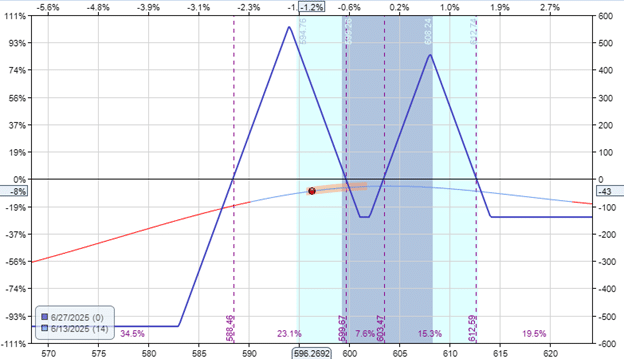
Here is an example of a double calendar on the S&P 500 ETF using two contracts with about $500 of total risk:
Date: June 12, 2025
Price: SPY @ $602.21
Sell two contracts June 27, SPY $607 call
Buy two contracts July 3rd, SPY $607 call
Sell two contracts June 27, SPY $597 put
Buy two contracts July 3rd, SPY $597 put
Net debit: -$520
For this double calendar, the vega Greek is positive 37, as shown in the histogram above.
This means that the position benefits when the implied volatility of the underlying increases.
Therefore, this structure is great when implied volatility is relatively low.
This means that when volatility is already near the bottom, a double calendar trade is less likely to lose value from any further decline in volatility.
VIX is a measure of the S&P 500 volatility.
At the time of this trade, it is at 17.6, a moderate level.
A VIX between 12 and 15 would be considered low.
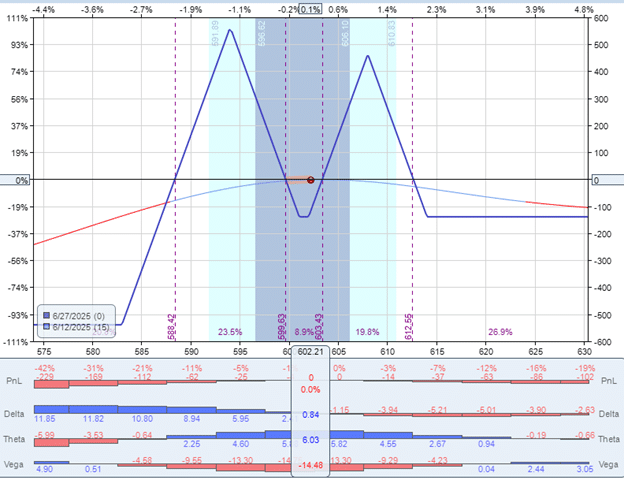
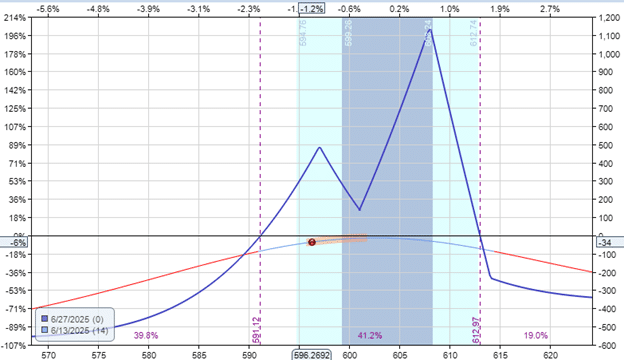
The double butterfly, on the other hand, has negative vega, meaning it loses value as volatility rises.
Date: June 12, 2025
Price: SPY @ $602.21
Call Butterfly:
Buy one contract June 27, SPY $614 call
Sell two contracts June 27, SPY $608 call
Buy one contract June 27, SPY $601 call
Debit: -$165
Put Butterfly
Buy one contract June 27, SPY $602 put
Sell two contracts June 27 SPY $594 put
Buy one contract June 27, SPY $583 put
Debit: -$75
Because there are six option strikes (or six legs) in this trade, we need to place this as two separate orders.
The overall risk in the trade is $539, or about $500, to make it comparable to the calendar example.
In this structure, vega is -14.
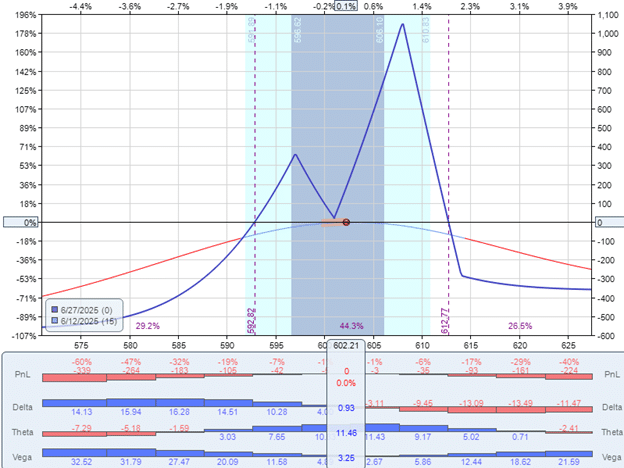
Now, if you’re uncertain about the direction of volatility, a hybrid combination structure consisting of a calendar and a butterfly may be more appropriate.
Date: June 12, 2025
Price: SPY @ $602.21
Call Butterfly:
Buy two contracts June 27, SPY $614 call
Sell four contracts June 27, SPY $608 call
Buy two contracts June 27, SPY $601 call
Debit: -$330
Put Calendar:
Sell two contracts June 27 SPY $597 put
Buy two contracts July 3rd, SPY $597 put
Debit: -$233
In this setup, the butterfly carries negative vega while the calendar has positive vega, helping offset each other and reducing the structure’s overall sensitivity to volatility changes.
Its overall vega is relatively neutral at 3.
If you look at the Greeks histogram in the above three structures, you see that they are configured to be delta-neutral within plus or minus one delta.
The breakeven points of the expiration graph are also about the same for all three structures.
This is where the expiration graph crosses the zero-profit horizontal.
In our cases, the breakeven points are $590 and $612.
If SPY falls in between these two prices at expiration, the trade should be profitable.
The wider apart the breakeven points, the higher the probability of success.
For structures that contain time spreads, such as calendars, these breakeven points can shift as the trade progresses.
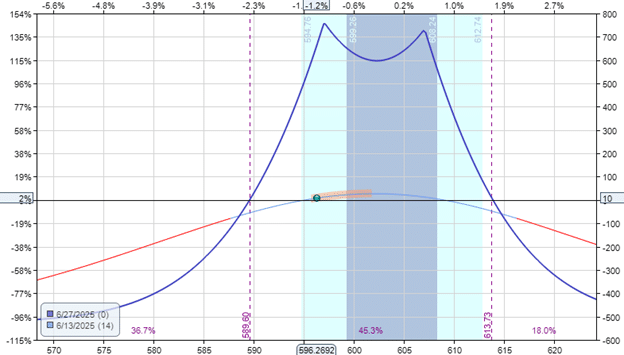
By the end of the following day, SPY dropped 6 points to $596.27 – equivalent to a 60-point move in the SPX.
It is not a severe drop, but certainly noticeable.
Such moves are often accompanied by increased volatility.
VIX went from 17.6 to 21.6.
The double calendar fared the best with a gain of $10 because it benefits in part from volatility increases.
If you compare the before-and-after snapshots of the model, you see that the T+0 line rose.
And the expiration graph expanded, widening the breakeven points slightly.
The double-fly fared the worst, losing -$43, because it is hurt by rising volatility…
You see that its T+0 line had dropped below the zero-profit horizontal.
Its expiration graph and breakeven points remain the same, as they do not change for structures with all options on the same expiration date.
The hybrid structure’s result is between the previous two examples, with a loss -$34.
It had neutral vega and was not affected too much by the change in volatility, as we can see that its T+0 line was exactly as it was before.
Its loss is due to the underlying’s price movement, as was the case with the other two structures.
The double calendar’s volatility benefit offset the loss from the price move.
At the same time, the increased volatility exacerbated the loss on the double fly.
In summary, understanding how vega behaves across different double structures is crucial for choosing the right strategy in varying volatility conditions.
The double calendar thrives when volatility is low and expected to rise.
The double butterfly performs best in environments with stable or declining volatility.
The hybrid structure offers a balanced approach when volatility direction is uncertain.
It is the structure that is least sensitive to volatility.
Traders who want to hedge their directional and volatility risk while isolating their theta decay will want to consider the hybrid structure.
By aligning your trade choice with the market’s volatility outlook, you can better manage risk and improve the consistency of your returns.
We hope you enjoyed this article on comparing double options structures.
If you have any questions, please send an email or leave a comment below.
Trade safe!
Disclaimer: The information above is for educational purposes only and should not be treated as investment advice. The strategy presented would not be suitable for investors who are not familiar with exchange traded options. Any readers interested in this strategy should do their own research and seek advice from a licensed financial adviser.
Source link