COT Energy Charts: Bloomberg Commodity Index Speculator Bets Surge Higher
By InvestMacro
Here are the latest charts and statistics for the Commitment of Traders (COT) data published by the Commodities Futures Trading Commission (CFTC).
The latest COT data is updated through Tuesday March 31st and shows a quick view of how large traders (for-profit speculators and commercial entities) were positioned in the futures markets.
Weekly Speculator Changes led by the Bloomberg Commodity Index
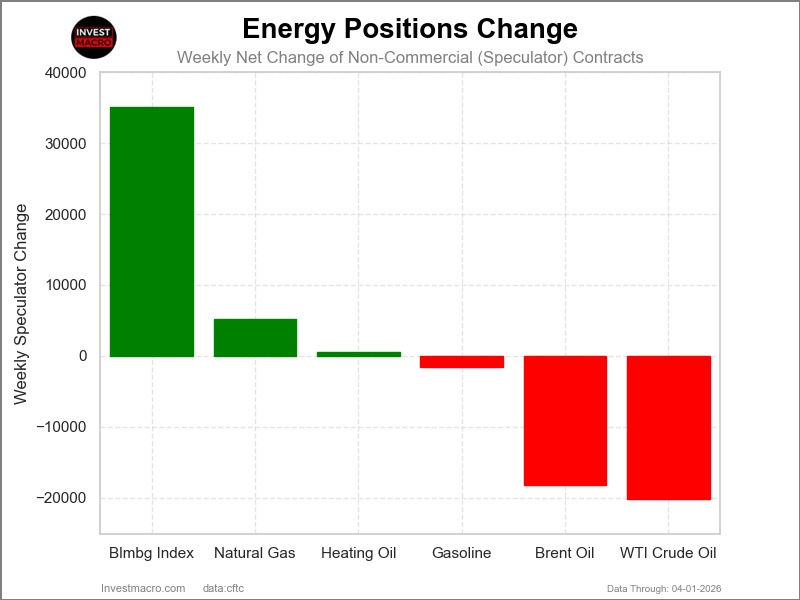
The COT energy market speculator bets were mixed this week as three out of the six energy markets we cover had higher positioning while the other three markets had lower speculator contracts.
Leading the gains for the energy markets was the Bloomberg Commodity Index (35,029 contracts) with Natural Gas (5,151 contracts) and Heating Oil (525 contracts) also having positive weeks.
The markets with declines in speculator bets for the week were WTI Crude (-20,132 contracts), Brent Oil (-18,260 contracts) and with Gasoline (-1,520 contracts) also recording lower bets on the week.
Bloomberg Commodity Index Speculator Bets Surge Higher
Highlighting the Energy Speculative Positioning this week was the strong gains in the Bloomberg Commodity Index. The net weekly position rose this week for a fourth consecutive week and this week’s gain, by a total of 35,029 contracts, marks the highest one-week increase on record, according to the CFTC data dating back to 2016. The Bloomberg Index is made up of multiple types of commodities with energy comprising approximately 30% of the Index. The Index price has been surging higher since the start of the Iran war and is up by approximately 33% in just the past 90 days.
WTI Crude Oil price leads the Energy market price performance
In the Energy markets this week, WTI Crude Oil saw a strong jump by almost 12% with an 11.94% surge higher over the past five days. The Bloomberg Commodity Index comes in next with a strong 5.14% gain on the week. Gasoline was up by 1.17%.
On the downside in performance, Heating Oil dipped this week by -2.99%, while Brent Crude Oil also fell by -3.14%. The leading market for the downside was Natural Gas, which dropped by -7.44% on the week.
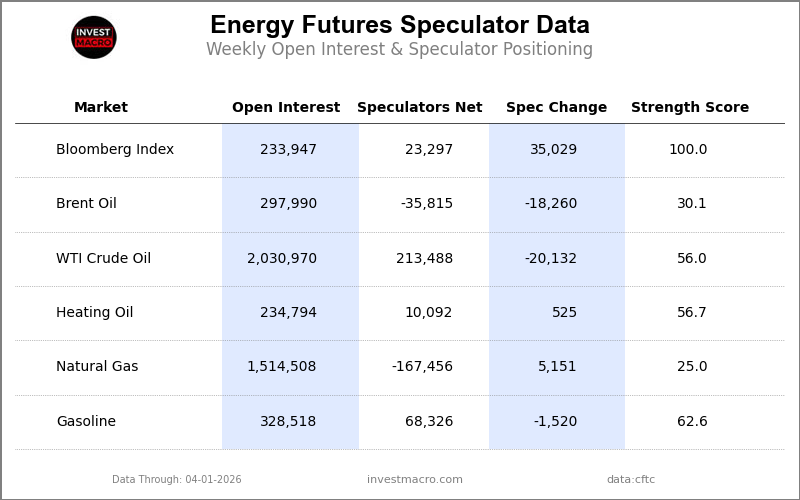
Energy Data:
Legend: Weekly Speculators Change | Speculators Current Net Position | Speculators Strength Score compared to last 3-Years (0-100 range)
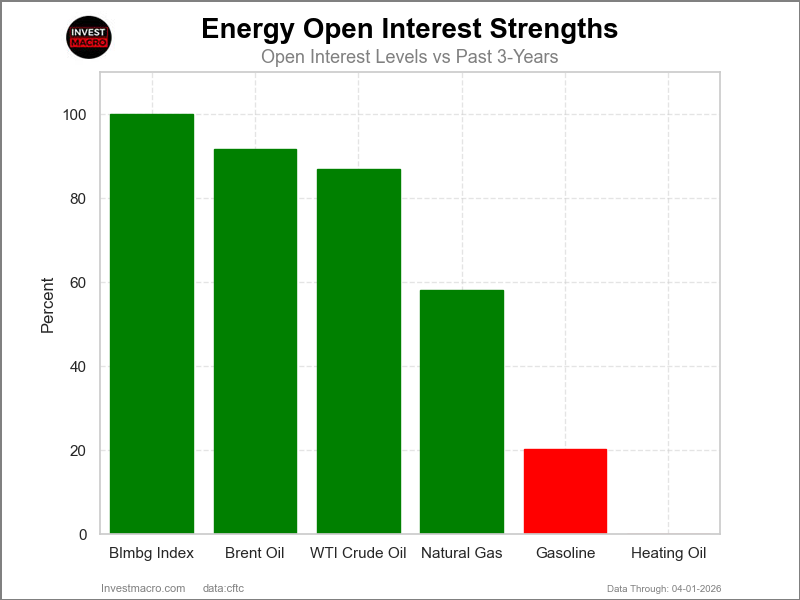
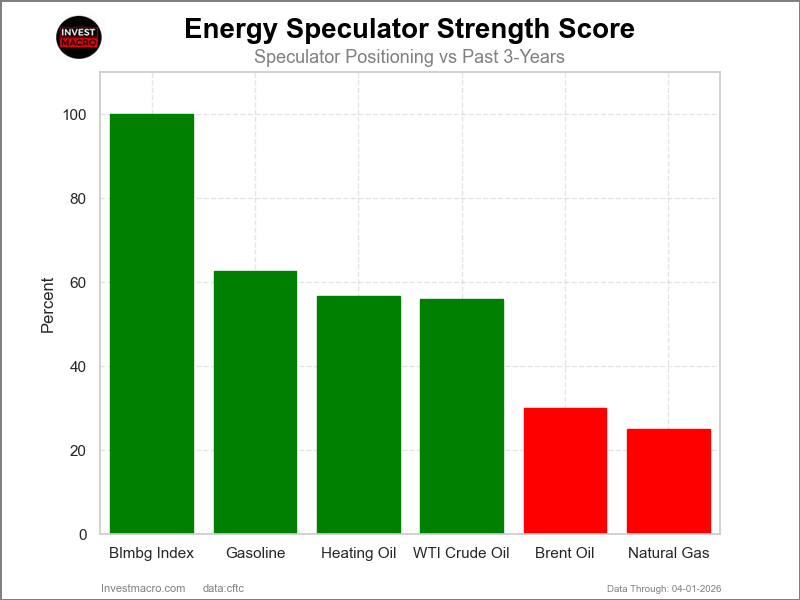
Strength Scores led by Bloomberg Index & Gasoline
COT Strength Scores (a normalized measure of Speculator positions over a 3-Year range, from 0 to 100 where above 80 is Extreme-Bullish and below 20 is Extreme-Bearish) showed that the Bloomberg Index (100.0 percent) and Gasoline (62.6 percent) lead the energy markets this week.
On the downside, Natural Gas (25.0 percent) and Brent Oil (30.1 percent) comes in at the lowest strength level currently.
Strength Statistics:
WTI Crude Oil (56.0 percent) vs WTI Crude Oil previous week (62.5 percent)
Brent Crude Oil (30.1 percent) vs Brent Crude Oil previous week (56.1 percent)
Natural Gas (25.0 percent) vs Natural Gas previous week (21.7 percent)
Gasoline (62.6 percent) vs Gasoline previous week (64.3 percent)
Heating Oil (56.7 percent) vs Heating Oil previous week (56.1 percent)
Bloomberg Commodity Index (100.0 percent) vs Bloomberg Commodity Index previous week (23.8 percent)
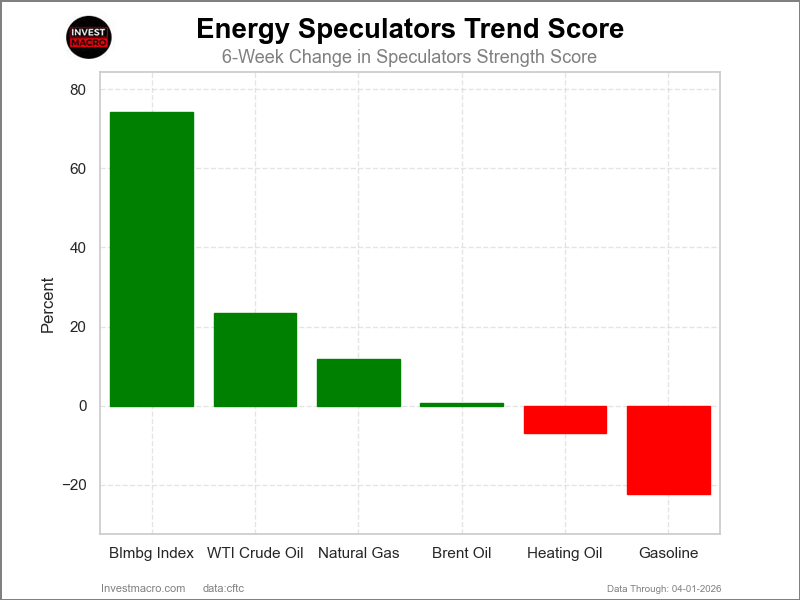
Bloomberg Index & WTI Crude top the 6-Week Strength Trends
COT Strength Score Trends (or move index, calculates the 6-week changes in strength scores) showed that the Bloomberg Index (74.4 percent) and WTI Crude (23.3 percent) lead the past six weeks trends for the energy markets.
Gasoline (-22.5 percent) leads the downside trend scores currently with Heating Oil (-7.0 percent) as the next market with lower trend scores.
Move Statistics:
WTI Crude Oil (23.3 percent) vs WTI Crude Oil previous week (37.3 percent)
Brent Crude Oil (0.6 percent) vs Brent Crude Oil previous week (26.4 percent)
Natural Gas (11.8 percent) vs Natural Gas previous week (-0.5 percent)
Gasoline (-22.5 percent) vs Gasoline previous week (-22.2 percent)
Heating Oil (-7.0 percent) vs Heating Oil previous week (-13.0 percent)
Bloomberg Commodity Index (74.4 percent) vs Bloomberg Commodity Index previous week (-1.6 percent)
Individual COT Market Charts:
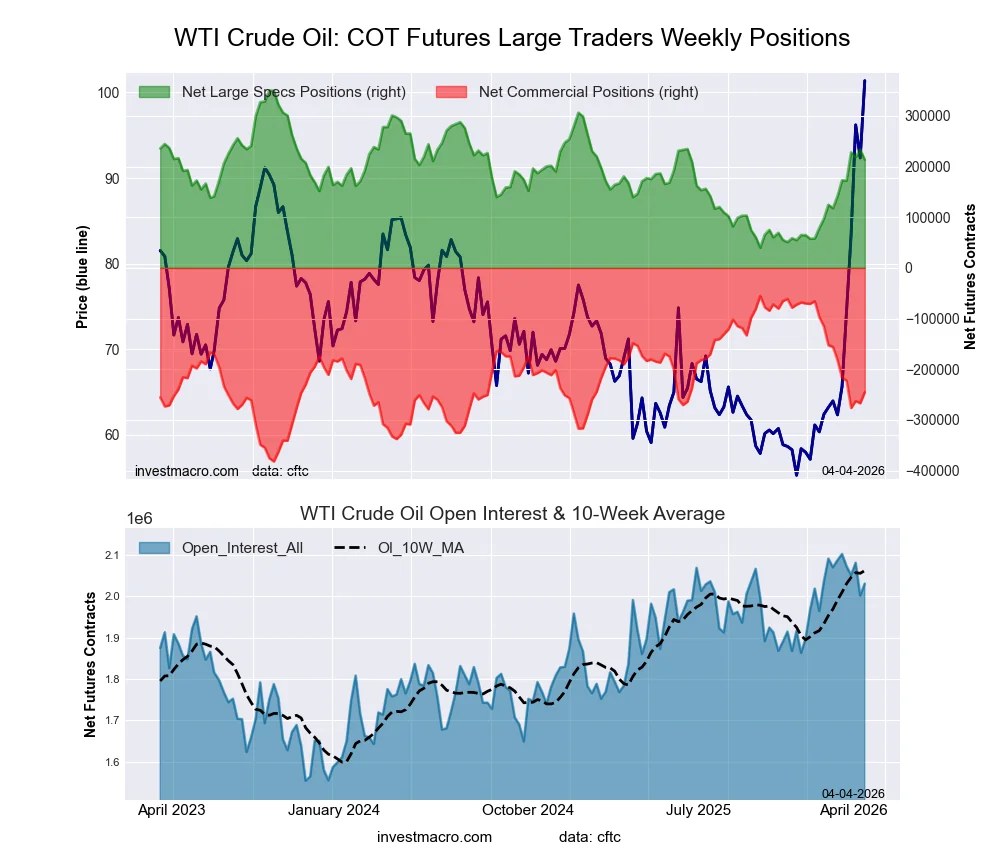
WTI Crude Oil Futures:
The WTI Crude Oil Futures large speculator standing this week totaled a net position of 213,488 contracts in the data reported through Tuesday. This was a weekly reduction of -20,132 contracts from the previous week which had a total of 233,620 net contracts.
This week’s current strength score (the trader positioning range over the past three years, measured from 0 to 100) shows the speculators are currently Bullish with a score of 56.0 percent. The commercials are Bearish with a score of 41.9 percent and the small traders (not shown in chart) are Bullish with a score of 63.3 percent.
Price Trend-Following Model: Strong Uptrend
Our weekly trend-following model classifies the current market price position as: Strong Uptrend.
| WTI Crude Oil Futures Statistics | SPECULATORS | COMMERCIALS | SMALL TRADERS |
| – Percent of Open Interest Longs: | 18.6 | 42.9 | 3.7 |
| – Percent of Open Interest Shorts: | 8.1 | 54.9 | 2.2 |
| – Net Position: | 213,488 | -245,091 | 31,603 |
| – Gross Longs: | 378,087 | 870,799 | 75,768 |
| – Gross Shorts: | 164,599 | 1,115,890 | 44,165 |
| – Long to Short Ratio: | 2.3 to 1 | 0.8 to 1 | 1.7 to 1 |
| NET POSITION TREND: | |||
| – Strength Index Score (3 Year Range Pct): | 56.0 | 41.9 | 63.3 |
| – Strength Index Reading (3 Year Range): | Bullish | Bearish | Bullish |
| NET POSITION MOVEMENT INDEX: | |||
| – 6-Week Change in Strength Index: | 23.3 | -19.4 | -17.1 |
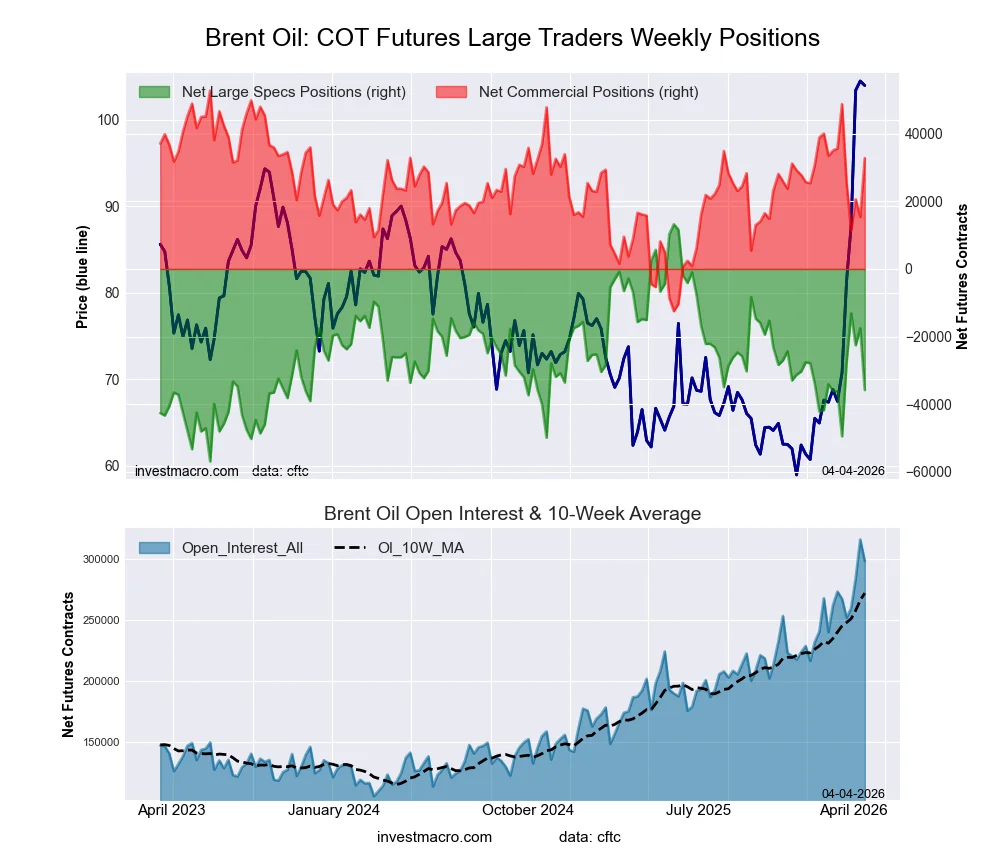
Brent Crude Oil Futures:
The Brent Crude Oil Futures large speculator standing this week totaled a net position of -35,815 contracts in the data reported through Tuesday. This was a weekly reduction of -18,260 contracts from the previous week which had a total of -17,555 net contracts.
This week’s current strength score (the trader positioning range over the past three years, measured from 0 to 100) shows the speculators are currently Bearish with a score of 30.1 percent. The commercials are Bullish with a score of 69.4 percent and the small traders (not shown in chart) are Bullish with a score of 70.7 percent.
Price Trend-Following Model: Strong Uptrend
Our weekly trend-following model classifies the current market price position as: Strong Uptrend.
| Brent Crude Oil Futures Statistics | SPECULATORS | COMMERCIALS | SMALL TRADERS |
| – Percent of Open Interest Longs: | 23.5 | 41.9 | 3.8 |
| – Percent of Open Interest Shorts: | 35.5 | 30.9 | 2.8 |
| – Net Position: | -35,815 | 32,776 | 3,039 |
| – Gross Longs: | 69,891 | 124,719 | 11,470 |
| – Gross Shorts: | 105,706 | 91,943 | 8,431 |
| – Long to Short Ratio: | 0.7 to 1 | 1.4 to 1 | 1.4 to 1 |
| NET POSITION TREND: | |||
| – Strength Index Score (3 Year Range Pct): | 30.1 | 69.4 | 70.7 |
| – Strength Index Reading (3 Year Range): | Bearish | Bullish | Bullish |
| NET POSITION MOVEMENT INDEX: | |||
| – 6-Week Change in Strength Index: | 0.6 | -4.5 | 28.7 |
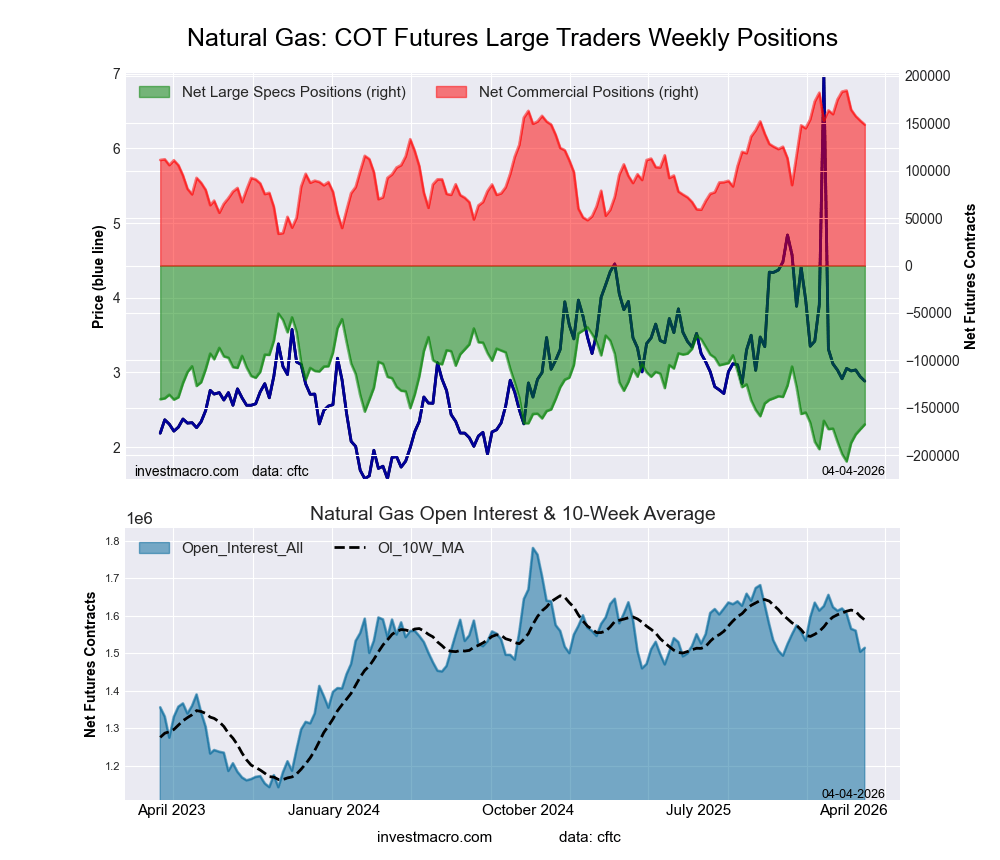
Natural Gas Futures:
The Natural Gas Futures large speculator standing this week totaled a net position of -167,456 contracts in the data reported through Tuesday. This was a weekly lift of 5,151 contracts from the previous week which had a total of -172,607 net contracts.
This week’s current strength score (the trader positioning range over the past three years, measured from 0 to 100) shows the speculators are currently Bearish with a score of 25.0 percent. The commercials are Bullish with a score of 76.2 percent and the small traders (not shown in chart) are Bullish with a score of 51.2 percent.
Price Trend-Following Model: Downtrend
Our weekly trend-following model classifies the current market price position as: Downtrend.
| Natural Gas Futures Statistics | SPECULATORS | COMMERCIALS | SMALL TRADERS |
| – Percent of Open Interest Longs: | 13.5 | 37.3 | 3.7 |
| – Percent of Open Interest Shorts: | 24.5 | 27.5 | 2.4 |
| – Net Position: | -167,456 | 148,428 | 19,028 |
| – Gross Longs: | 204,139 | 564,656 | 56,127 |
| – Gross Shorts: | 371,595 | 416,228 | 37,099 |
| – Long to Short Ratio: | 0.5 to 1 | 1.4 to 1 | 1.5 to 1 |
| NET POSITION TREND: | |||
| – Strength Index Score (3 Year Range Pct): | 25.0 | 76.2 | 51.2 |
| – Strength Index Reading (3 Year Range): | Bearish | Bullish | Bullish |
| NET POSITION MOVEMENT INDEX: | |||
| – 6-Week Change in Strength Index: | 11.8 | -17.5 | 20.3 |
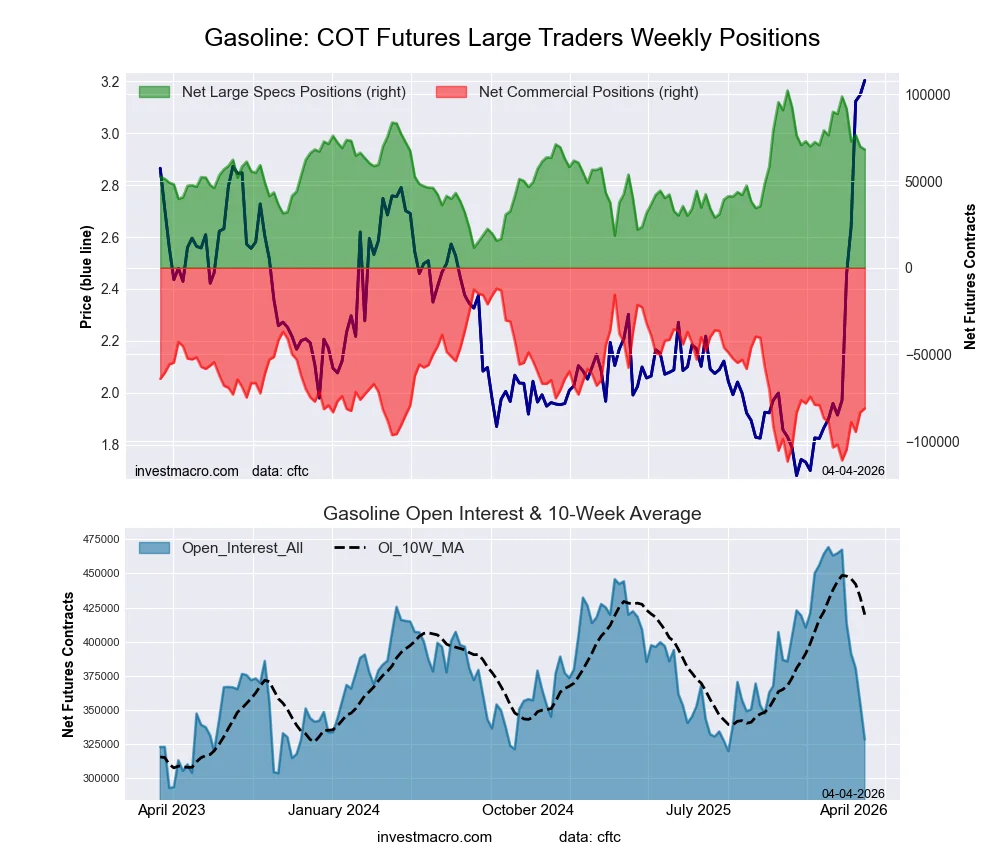
Gasoline Blendstock Futures:
The Gasoline Blendstock Futures large speculator standing this week totaled a net position of 68,326 contracts in the data reported through Tuesday. This was a weekly decline of -1,520 contracts from the previous week which had a total of 69,846 net contracts.
This week’s current strength score (the trader positioning range over the past three years, measured from 0 to 100) shows the speculators are currently Bullish with a score of 62.6 percent. The commercials are Bearish with a score of 30.7 percent and the small traders (not shown in chart) are Bullish with a score of 76.1 percent.
Price Trend-Following Model: Strong Uptrend
Our weekly trend-following model classifies the current market price position as: Strong Uptrend.
| Nasdaq Mini Futures Statistics | SPECULATORS | COMMERCIALS | SMALL TRADERS |
| – Percent of Open Interest Longs: | 26.6 | 49.0 | 8.6 |
| – Percent of Open Interest Shorts: | 5.8 | 73.7 | 4.7 |
| – Net Position: | 68,326 | -81,172 | 12,846 |
| – Gross Longs: | 87,284 | 160,968 | 28,280 |
| – Gross Shorts: | 18,958 | 242,140 | 15,434 |
| – Long to Short Ratio: | 4.6 to 1 | 0.7 to 1 | 1.8 to 1 |
| NET POSITION TREND: | |||
| – Strength Index Score (3 Year Range Pct): | 62.6 | 30.7 | 76.1 |
| – Strength Index Reading (3 Year Range): | Bullish | Bearish | Bullish |
| NET POSITION MOVEMENT INDEX: | |||
| – 6-Week Change in Strength Index: | -22.5 | 20.9 | -1.8 |
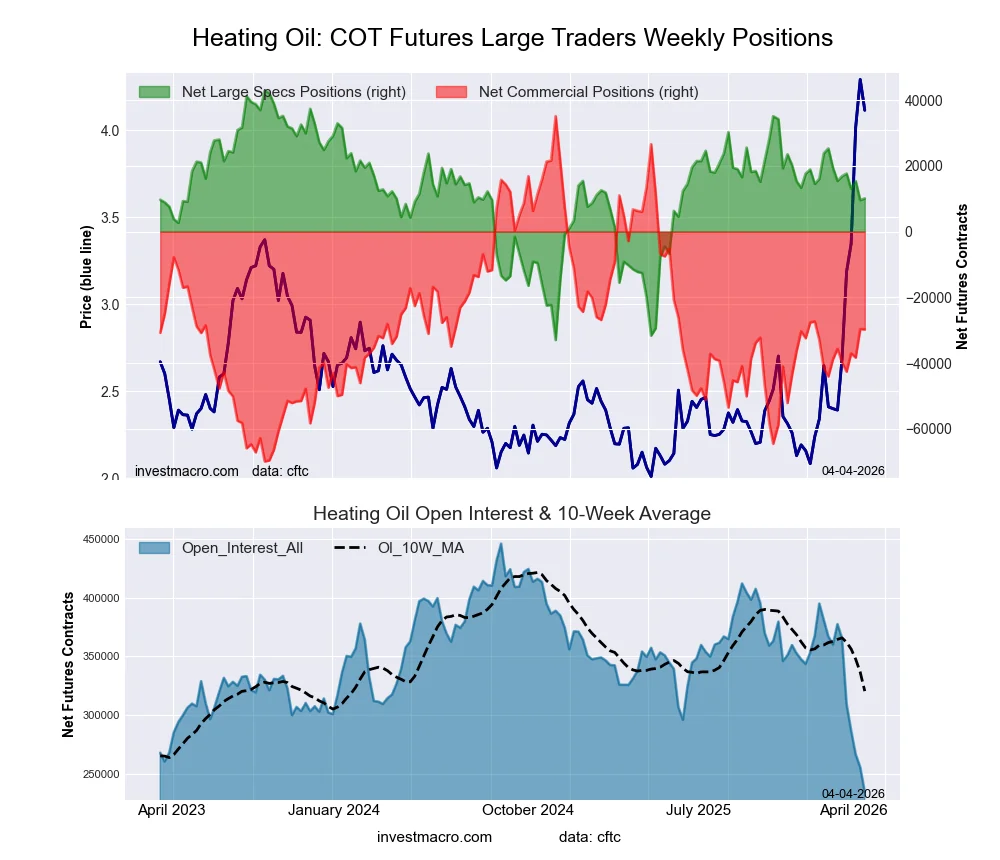
#2 Heating Oil NY-Harbor Futures:
The #2 Heating Oil NY-Harbor Futures large speculator standing this week totaled a net position of 10,092 contracts in the data reported through Tuesday. This was a weekly rise of 525 contracts from the previous week which had a total of 9,567 net contracts.
This week’s current strength score (the trader positioning range over the past three years, measured from 0 to 100) shows the speculators are currently Bullish with a score of 56.7 percent. The commercials are Bearish with a score of 38.2 percent and the small traders (not shown in chart) are Bullish with a score of 71.9 percent.
Price Trend-Following Model: Strong Uptrend
Our weekly trend-following model classifies the current market price position as: Strong Uptrend.
| Heating Oil Futures Statistics | SPECULATORS | COMMERCIALS | SMALL TRADERS |
| – Percent of Open Interest Longs: | 15.3 | 50.9 | 17.8 |
| – Percent of Open Interest Shorts: | 11.0 | 63.6 | 9.4 |
| – Net Position: | 10,092 | -29,760 | 19,668 |
| – Gross Longs: | 35,976 | 119,530 | 41,809 |
| – Gross Shorts: | 25,884 | 149,290 | 22,141 |
| – Long to Short Ratio: | 1.4 to 1 | 0.8 to 1 | 1.9 to 1 |
| NET POSITION TREND: | |||
| – Strength Index Score (3 Year Range Pct): | 56.7 | 38.2 | 71.9 |
| – Strength Index Reading (3 Year Range): | Bullish | Bearish | Bullish |
| NET POSITION MOVEMENT INDEX: | |||
| – 6-Week Change in Strength Index: | -7.0 | 5.6 | -1.5 |
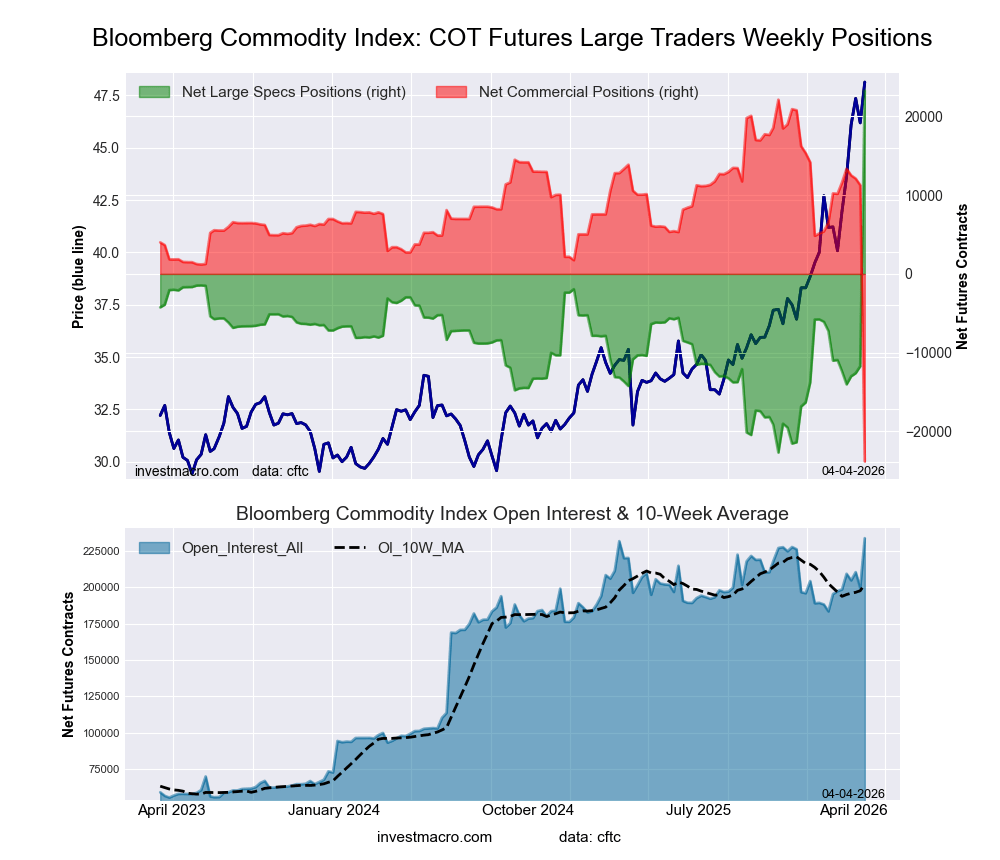
Bloomberg Commodity Index Futures:
The Bloomberg Commodity Index Futures large speculator standing this week totaled a net position of 23,297 contracts in the data reported through Tuesday. This was a weekly lift of 35,029 contracts from the previous week which had a total of -11,732 net contracts.
This week’s current strength score (the trader positioning range over the past three years, measured from 0 to 100) shows the speculators are currently Bullish-Extreme with a score of 100.0 percent. The commercials are Bearish-Extreme with a score of 0.0 percent and the small traders (not shown in chart) are Bullish with a score of 67.3 percent.
Price Trend-Following Model: Strong Uptrend
Our weekly trend-following model classifies the current market price position as: Strong Uptrend.
| Bloomberg Index Futures Statistics | SPECULATORS | COMMERCIALS | SMALL TRADERS |
| – Percent of Open Interest Longs: | 40.1 | 59.3 | 0.2 |
| – Percent of Open Interest Shorts: | 30.1 | 69.5 | 0.0 |
| – Net Position: | 23,297 | -23,828 | 531 |
| – Gross Longs: | 93,806 | 138,791 | 573 |
| – Gross Shorts: | 70,509 | 162,619 | 42 |
| – Long to Short Ratio: | 1.3 to 1 | 0.9 to 1 | 13.6 to 1 |
| NET POSITION TREND: | |||
| – Strength Index Score (3 Year Range Pct): | 100.0 | 0.0 | 67.3 |
| – Strength Index Reading (3 Year Range): | Bullish-Extreme | Bearish-Extreme | Bullish |
| NET POSITION MOVEMENT INDEX: | |||
| – 6-Week Change in Strength Index: | 74.4 | -74.0 | -17.0 |
Article By InvestMacro – Receive our weekly COT Reports by Email
*COT Report: The COT data, released weekly to the public each Friday, is updated through the most recent Tuesday (data is 3 days old) and shows a quick view of how large speculators or non-commercials (for-profit traders) were positioned in the futures markets.
The CFTC categorizes trader positions according to commercial hedgers (traders who use futures contracts for hedging as part of the business), non-commercials (large traders who speculate to realize trading profits) and nonreportable traders (usually small traders/speculators) as well as their open interest (contracts open in the market at time of reporting).See CFTC criteria here.
All information and opinions on this website and contained in this article are for general informational purposes only and do not constitute investment advice.

- COT Energy Charts: Bloomberg Commodity Index Speculator Bets Surge Higher Apr 5, 2026
- COT Soft Commodities Charts: Sugar Bets continue higher, Soybean Oil Bets at 5-Year High Apr 5, 2026
- Week Ahead: USDInd braces for slew of risk events Apr 3, 2026
- WTI oil prices surged by 11%, breaking above 111 dollars per barrel Apr 3, 2026
- GBP/USD: Geopolitical Tensions Drive Pound Selling Apr 3, 2026
- Investor optimism remains supported by signals of a possible de-escalation in the Middle East Apr 2, 2026
- USD/JPY – Yen Weakens Amid Geopolitical Uncertainty Apr 2, 2026
- Signs of diplomatic dialogue have appeared in the Middle East – markets reacted positively Apr 1, 2026
- Gold Rises as Geopolitical Risk Premium Fades Apr 1, 2026
- WTI crude oil has settled above $100 a barrel. Market participants prefer to hedge risks Mar 31, 2026
Source link