COT Metals Charts: Speculator Bets led by Copper & Palladium
By InvestMacro
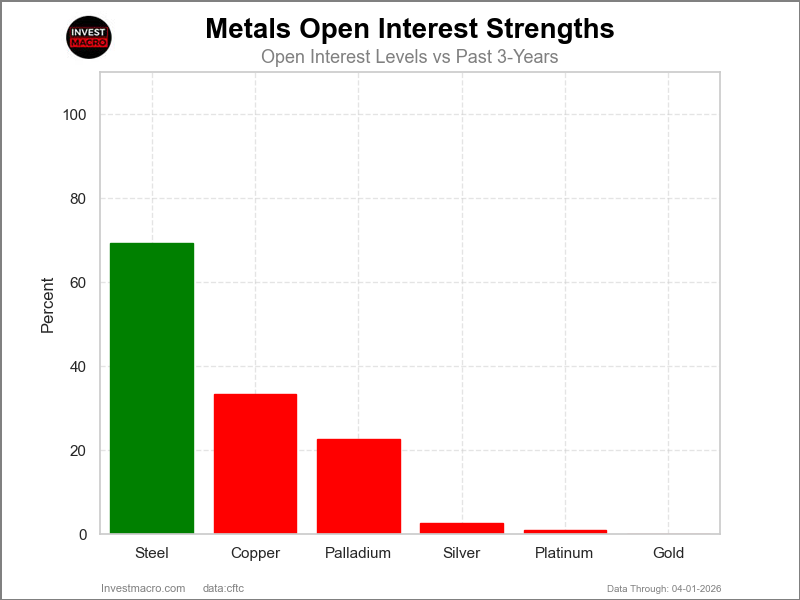
Open Interest (OI) is the amount of contracts that are currently live in the marketplace. OI Strength shows the current strength compared to the past 3-years.
Here are the latest charts and statistics for the Commitment of Traders (COT) data published by the Commodities Futures Trading Commission (CFTC).
The latest COT data is updated through Tuesday March 31st and shows a quick view of how large traders (for-profit speculators and commercial entities) were positioned in the futures markets.
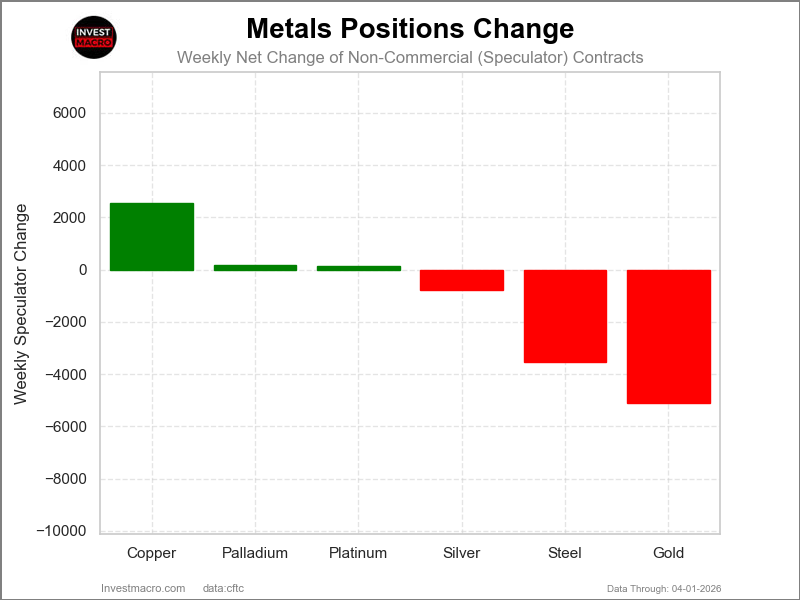
Weekly Speculator Changes led by Copper & Palladium
The COT metals markets speculator bets were overall mixed this week as three out of the six metals markets we cover had higher positioning while the other three markets had lower speculator contracts.
Leading the gains for the metals was Copper (2,567 contracts) with Palladium (192 contracts) and Platinum (139 contracts) also seeing positive weeks.
The markets with declines in speculator bets for the week were Gold (-5,125 contracts), Steel (-3,544 contracts) and with Silver (-769 contracts) also having lower bets on the week.
Palladium leads the Metals price performance
In the Metals markets this week, Palladium was the biggest winner for price performance with a 7.20% gain over the past 5 days. Platinum was higher as well by 5.09%, while Silver came in third with a 4.48% advance. Gold also rose higher with a strong 4.17% rise. Steel was up by 1.84%, and Copper rounds out the gainers with a 1.62% advance.
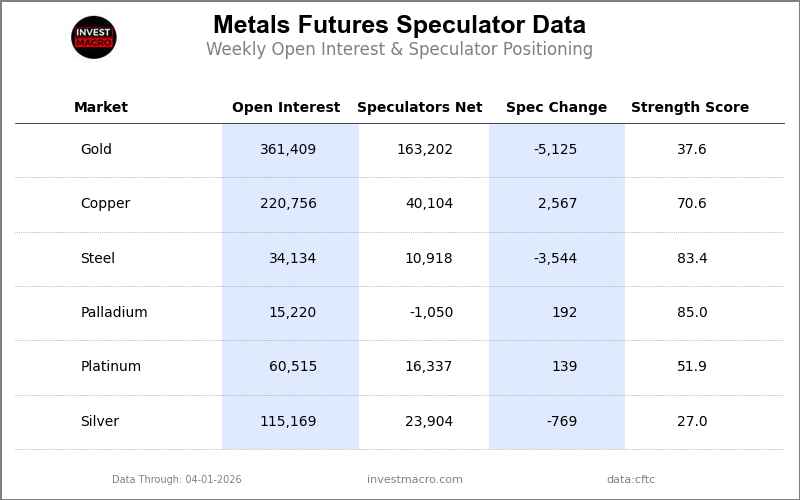
Metals Data:
Legend: Weekly Speculators Change | Speculators Current Net Position | Speculators Strength Score compared to last 3-Years (0-100 range)
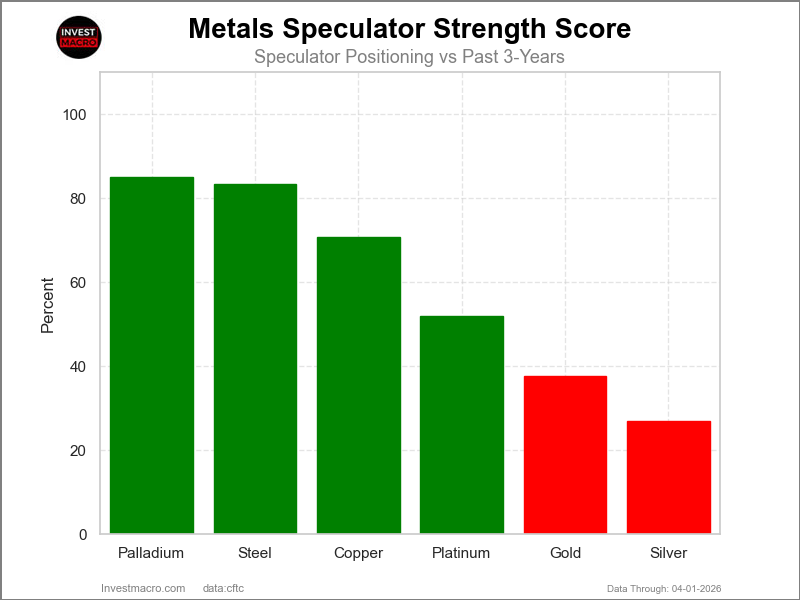
Strength Scores led by Palladium & Steel
COT Strength Scores (a normalized measure of Speculator positions over a 3-Year range, from 0 to 100 where above 80 is Extreme-Bullish and below 20 is Extreme-Bearish) showed that Palladium (85 percent) and Steel (83 percent) lead the metals markets this week.
On the downside, Silver (27 percent) comes in at the lowest strength level currently and the next lowest strength score was Gold (38 percent).
Strength Statistics:
Gold (37.6 percent) vs Gold previous week (39.7 percent)
Silver (27.0 percent) vs Silver previous week (28.3 percent)
Copper (70.6 percent) vs Copper previous week (68.2 percent)
Platinum (51.9 percent) vs Platinum previous week (51.5 percent)
Palladium (85.0 percent) vs Palladium previous week (83.7 percent)
Steel (83.4 percent) vs Steel previous week (100.0 percent)
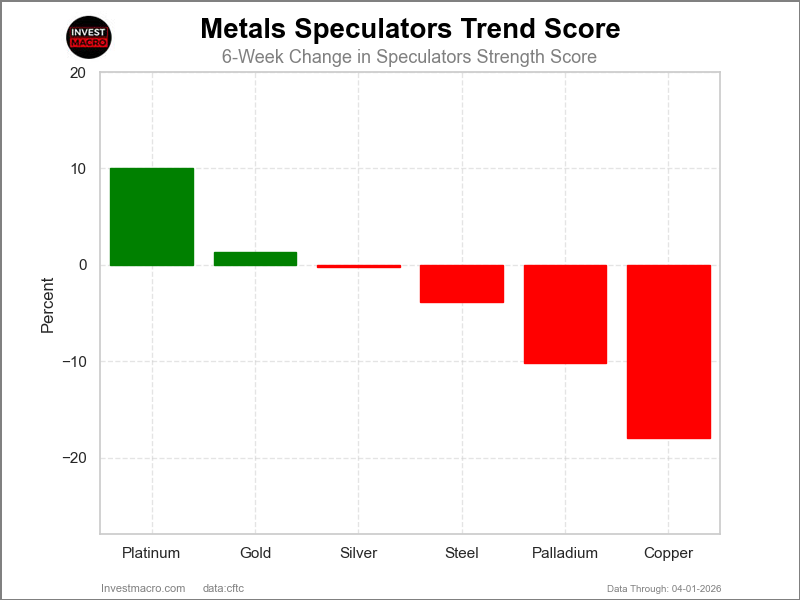
Platinum & Gold top the 6-Week Strength Trends
COT Strength Score Trends (or move index, calculates the 6-week changes in strength scores) showed that Platinum (10 percent) and Gold (1 percent) lead the past six weeks trends for metals.
Copper (-18 percent) leads the downside trend scores currently with Palladium (-10 percent) as the next market with lower trend scores.
Move Statistics:
Gold (1.3 percent) vs Gold previous week (3.4 percent)
Silver (-0.2 percent) vs Silver previous week (2.9 percent)
Copper (-17.9 percent) vs Copper previous week (-7.8 percent)
Platinum (10.0 percent) vs Platinum previous week (10.3 percent)
Palladium (-10.2 percent) vs Palladium previous week (-11.6 percent)
Steel (-3.8 percent) vs Steel previous week (14.4 percent)
Individual Markets:
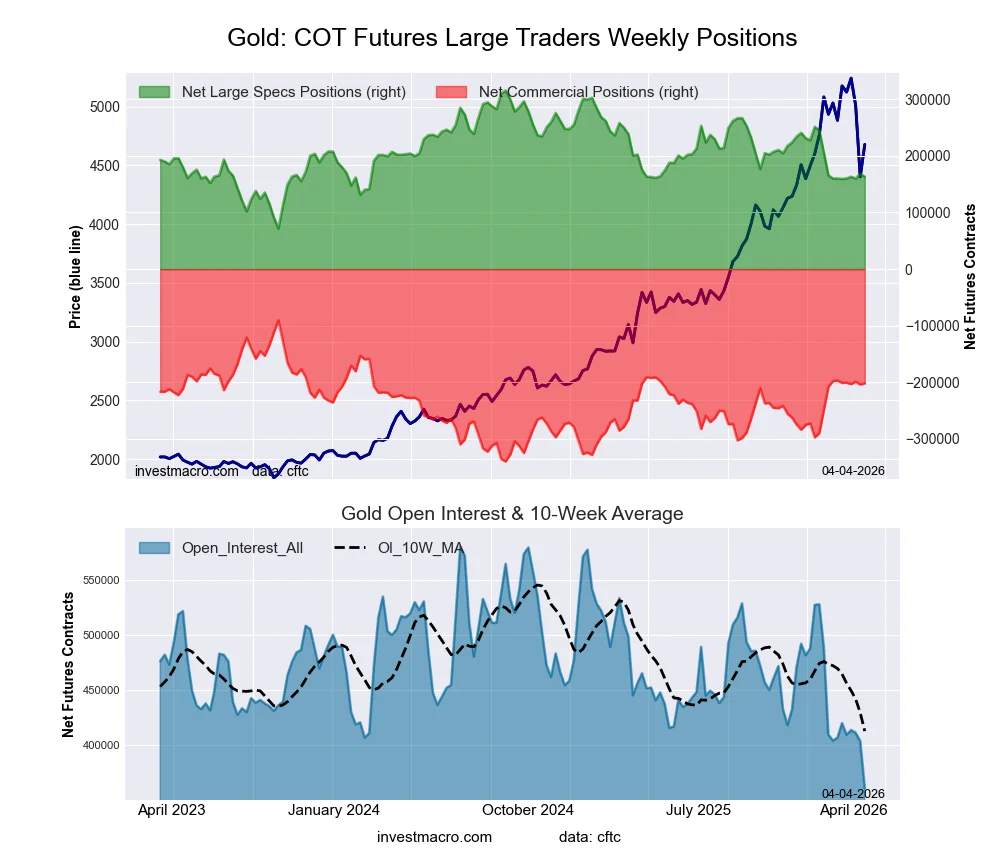
Gold Comex Futures:
The Gold Comex Futures large speculator standing this week reached a net position of 163,202 contracts in the data reported through Tuesday. This was a weekly decline of -5,125 contracts from the previous week which had a total of 168,327 net contracts.
This week’s current strength score (the trader positioning range over the past three years, measured from 0 to 100) shows the speculators are currently Bearish with a score of 37.6 percent. The commercials are Bullish with a score of 55.4 percent and the small traders (not shown in chart) are Bullish with a score of 78.3 percent.
Price Trend-Following Model: Uptrend
Our weekly trend-following model classifies the current market price position as: Uptrend.
| Gold Futures Statistics | SPECULATORS | COMMERCIALS | SMALL TRADERS |
| – Percent of Open Interest Longs: | 57.4 | 16.2 | 14.0 |
| – Percent of Open Interest Shorts: | 12.3 | 72.0 | 3.4 |
| – Net Position: | 163,202 | -201,640 | 38,438 |
| – Gross Longs: | 207,602 | 58,697 | 50,617 |
| – Gross Shorts: | 44,400 | 260,337 | 12,179 |
| – Long to Short Ratio: | 4.7 to 1 | 0.2 to 1 | 4.2 to 1 |
| NET POSITION TREND: | |||
| – Strength Index Score (3 Year Range Pct): | 37.6 | 55.4 | 78.3 |
| – Strength Index Reading (3 Year Range): | Bearish | Bullish | Bullish |
| NET POSITION MOVEMENT INDEX: | |||
| – 6-Week Change in Strength Index: | 1.3 | -1.9 | 4.6 |
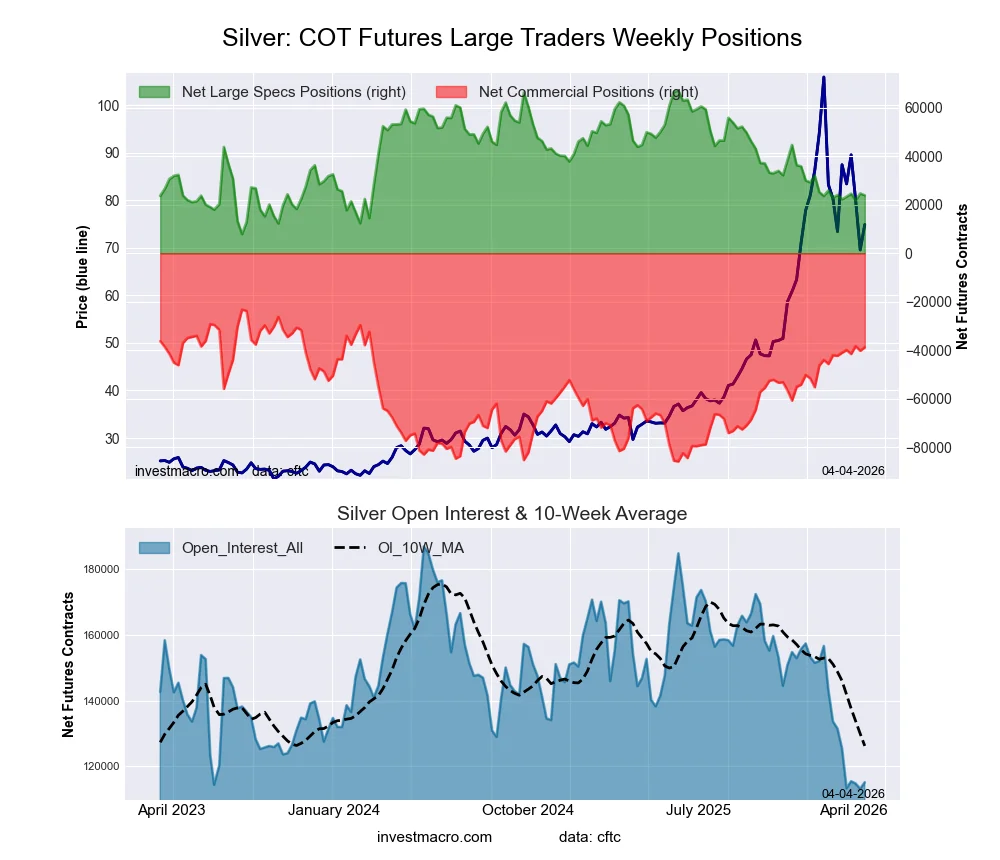
Silver Comex Futures:
The Silver Comex Futures large speculator standing this week reached a net position of 23,904 contracts in the data reported through Tuesday. This was a weekly decline of -769 contracts from the previous week which had a total of 24,673 net contracts.
This week’s current strength score (the trader positioning range over the past three years, measured from 0 to 100) shows the speculators are currently Bearish with a score of 27.0 percent. The commercials are Bullish with a score of 75.1 percent and the small traders (not shown in chart) are Bearish with a score of 34.9 percent.
Price Trend-Following Model: Weak Uptrend
Our weekly trend-following model classifies the current market price position as: Weak Uptrend.
| Silver Futures Statistics | SPECULATORS | COMMERCIALS | SMALL TRADERS |
| – Percent of Open Interest Longs: | 29.1 | 26.0 | 21.2 |
| – Percent of Open Interest Shorts: | 8.3 | 59.7 | 8.3 |
| – Net Position: | 23,904 | -38,857 | 14,953 |
| – Gross Longs: | 33,463 | 29,892 | 24,465 |
| – Gross Shorts: | 9,559 | 68,749 | 9,512 |
| – Long to Short Ratio: | 3.5 to 1 | 0.4 to 1 | 2.6 to 1 |
| NET POSITION TREND: | |||
| – Strength Index Score (3 Year Range Pct): | 27.0 | 75.1 | 34.9 |
| – Strength Index Reading (3 Year Range): | Bearish | Bullish | Bearish |
| NET POSITION MOVEMENT INDEX: | |||
| – 6-Week Change in Strength Index: | -0.2 | 5.6 | -18.8 |
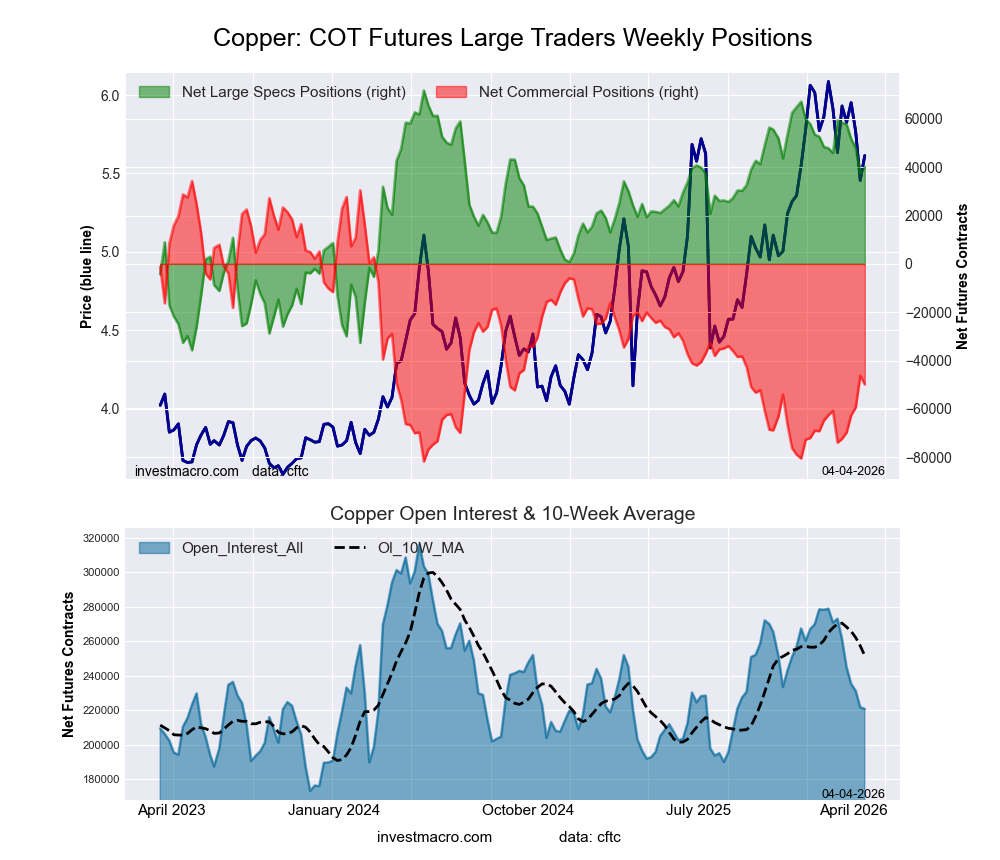
Copper Grade #1 Futures:
The Copper Grade #1 Futures large speculator standing this week reached a net position of 40,104 contracts in the data reported through Tuesday. This was a weekly boost of 2,567 contracts from the previous week which had a total of 37,537 net contracts.
This week’s current strength score (the trader positioning range over the past three years, measured from 0 to 100) shows the speculators are currently Bullish with a score of 70.6 percent. The commercials are Bearish with a score of 27.5 percent and the small traders (not shown in chart) are Bullish with a score of 64.4 percent.
Price Trend-Following Model: Weak Uptrend
Our weekly trend-following model classifies the current market price position as: Weak Uptrend.
| Copper Futures Statistics | SPECULATORS | COMMERCIALS | SMALL TRADERS |
| – Percent of Open Interest Longs: | 32.2 | 38.3 | 9.3 |
| – Percent of Open Interest Shorts: | 14.0 | 60.9 | 4.9 |
| – Net Position: | 40,104 | -49,809 | 9,705 |
| – Gross Longs: | 71,107 | 84,546 | 20,448 |
| – Gross Shorts: | 31,003 | 134,355 | 10,743 |
| – Long to Short Ratio: | 2.3 to 1 | 0.6 to 1 | 1.9 to 1 |
| NET POSITION TREND: | |||
| – Strength Index Score (3 Year Range Pct): | 70.6 | 27.5 | 64.4 |
| – Strength Index Reading (3 Year Range): | Bullish | Bearish | Bullish |
| NET POSITION MOVEMENT INDEX: | |||
| – 6-Week Change in Strength Index: | -17.9 | 20.8 | -25.0 |
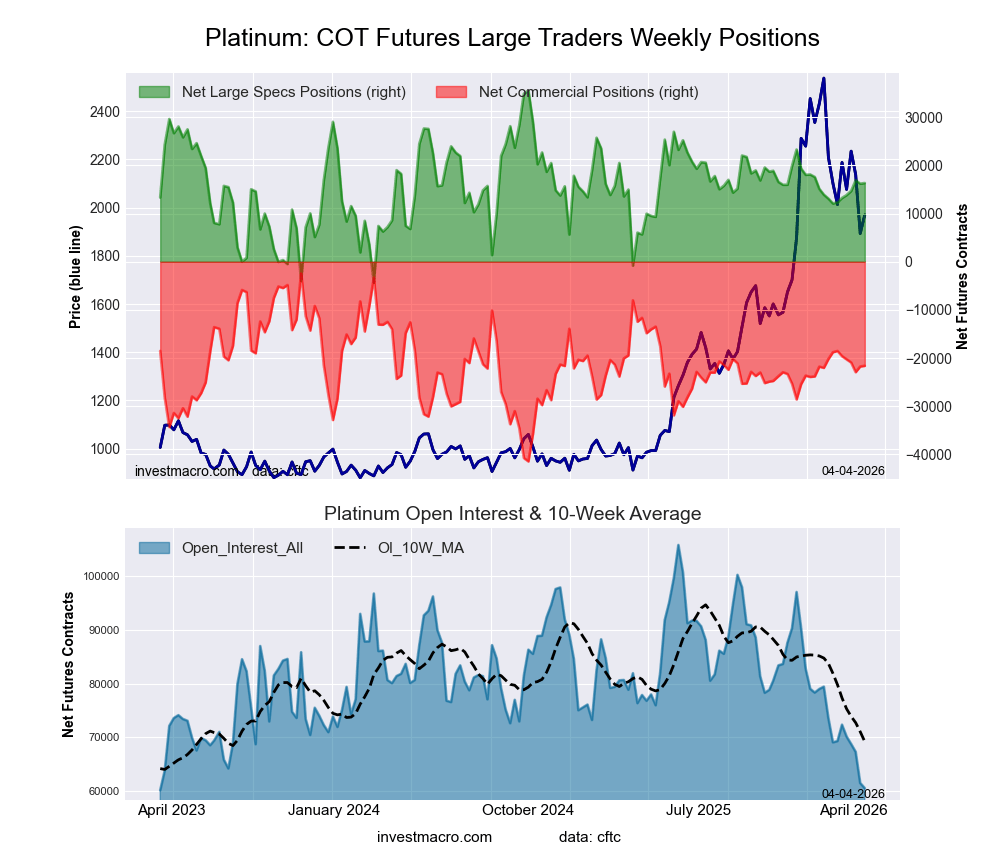
Platinum Futures:
The Platinum Futures large speculator standing this week reached a net position of 16,337 contracts in the data reported through Tuesday. This was a weekly lift of 139 contracts from the previous week which had a total of 16,198 net contracts.
This week’s current strength score (the trader positioning range over the past three years, measured from 0 to 100) shows the speculators are currently Bullish with a score of 51.9 percent. The commercials are Bullish with a score of 50.8 percent and the small traders (not shown in chart) are Bullish with a score of 59.2 percent.
Price Trend-Following Model: Weak Uptrend
Our weekly trend-following model classifies the current market price position as: Weak Uptrend.
| Platinum Futures Statistics | SPECULATORS | COMMERCIALS | SMALL TRADERS |
| – Percent of Open Interest Longs: | 43.5 | 30.5 | 13.3 |
| – Percent of Open Interest Shorts: | 16.5 | 66.1 | 4.6 |
| – Net Position: | 16,337 | -21,603 | 5,266 |
| – Gross Longs: | 26,303 | 18,427 | 8,060 |
| – Gross Shorts: | 9,966 | 40,030 | 2,794 |
| – Long to Short Ratio: | 2.6 to 1 | 0.5 to 1 | 2.9 to 1 |
| NET POSITION TREND: | |||
| – Strength Index Score (3 Year Range Pct): | 51.9 | 50.8 | 59.2 |
| – Strength Index Reading (3 Year Range): | Bullish | Bullish | Bullish |
| NET POSITION MOVEMENT INDEX: | |||
| – 6-Week Change in Strength Index: | 10.0 | -7.8 | -10.6 |
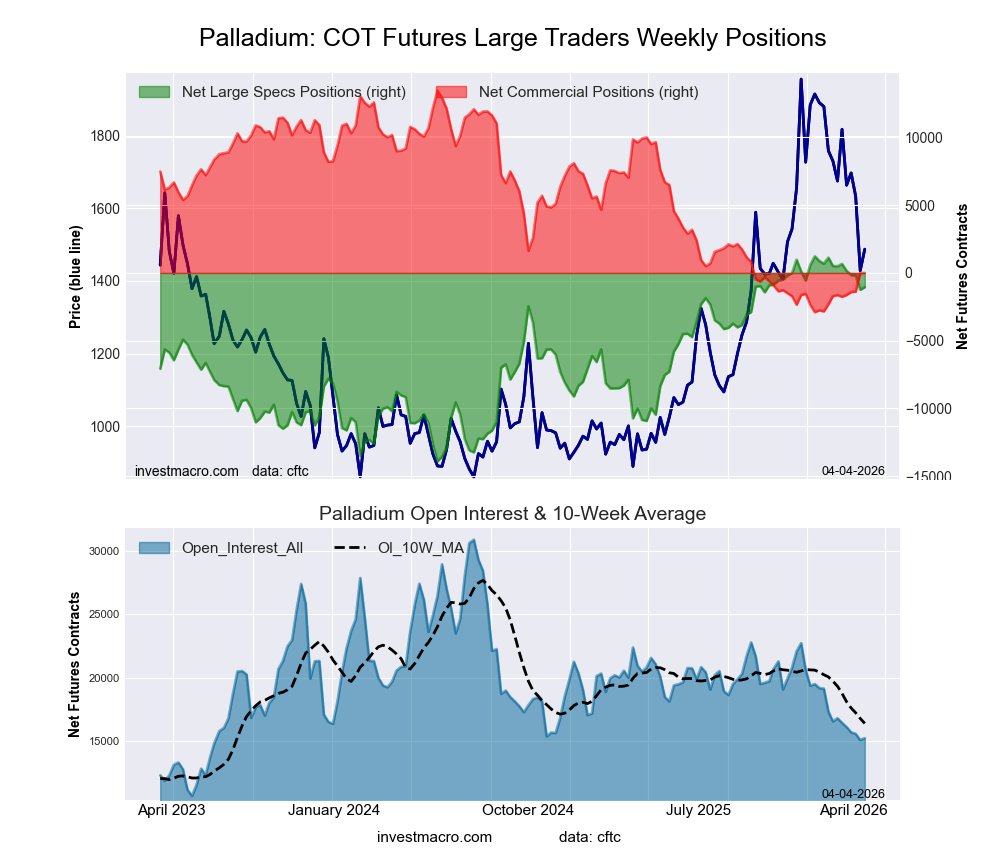
Palladium Futures:
The Palladium Futures large speculator standing this week reached a net position of -1,050 contracts in the data reported through Tuesday. This was a weekly increase of 192 contracts from the previous week which had a total of -1,242 net contracts.
This week’s current strength score (the trader positioning range over the past three years, measured from 0 to 100) shows the speculators are currently Bullish-Extreme with a score of 85.0 percent. The commercials are Bearish-Extreme with a score of 17.6 percent and the small traders (not shown in chart) are Bullish with a score of 56.7 percent.
Price Trend-Following Model: Strong Downtrend
Our weekly trend-following model classifies the current market price position as: Strong Downtrend.
| Palladium Futures Statistics | SPECULATORS | COMMERCIALS | SMALL TRADERS |
| – Percent of Open Interest Longs: | 44.9 | 35.7 | 14.6 |
| – Percent of Open Interest Shorts: | 51.8 | 35.8 | 7.7 |
| – Net Position: | -1,050 | -9 | 1,059 |
| – Gross Longs: | 6,835 | 5,433 | 2,228 |
| – Gross Shorts: | 7,885 | 5,442 | 1,169 |
| – Long to Short Ratio: | 0.9 to 1 | 1.0 to 1 | 1.9 to 1 |
| NET POSITION TREND: | |||
| – Strength Index Score (3 Year Range Pct): | 85.0 | 17.6 | 56.7 |
| – Strength Index Reading (3 Year Range): | Bullish-Extreme | Bearish-Extreme | Bullish |
| NET POSITION MOVEMENT INDEX: | |||
| – 6-Week Change in Strength Index: | -10.2 | 9.9 | -2.9 |
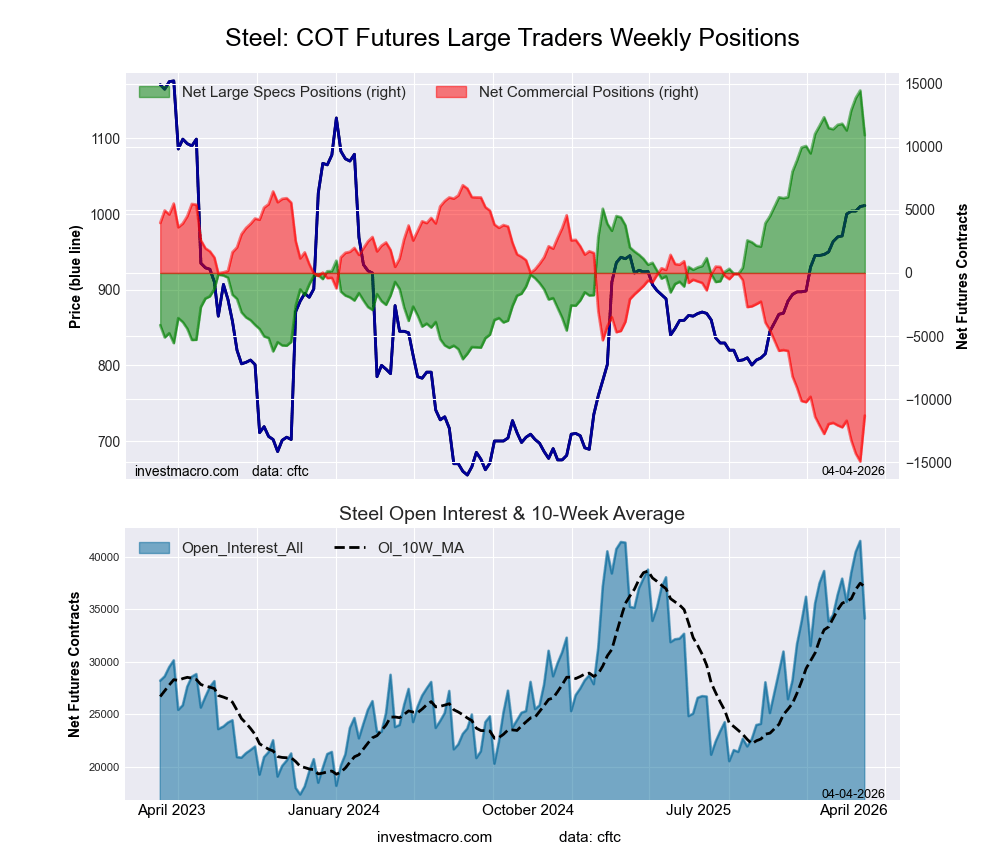
Steel Futures Futures:
The Steel Futures large speculator standing this week reached a net position of 10,918 contracts in the data reported through Tuesday. This was a weekly decline of -3,544 contracts from the previous week which had a total of 14,462 net contracts.
This week’s current strength score (the trader positioning range over the past three years, measured from 0 to 100) shows the speculators are currently Bullish-Extreme with a score of 83.4 percent. The commercials are Bearish-Extreme with a score of 16.6 percent and the small traders (not shown in chart) are Bullish-Extreme with a score of 87.3 percent.
Price Trend-Following Model: Strong Uptrend
Our weekly trend-following model classifies the current market price position as: Strong Uptrend.
| Steel Futures Statistics | SPECULATORS | COMMERCIALS | SMALL TRADERS |
| – Percent of Open Interest Longs: | 34.8 | 61.1 | 1.4 |
| – Percent of Open Interest Shorts: | 2.8 | 94.2 | 0.2 |
| – Net Position: | 10,918 | -11,312 | 394 |
| – Gross Longs: | 11,871 | 20,848 | 473 |
| – Gross Shorts: | 953 | 32,160 | 79 |
| – Long to Short Ratio: | 12.5 to 1 | 0.6 to 1 | 6.0 to 1 |
| NET POSITION TREND: | |||
| – Strength Index Score (3 Year Range Pct): | 83.4 | 16.6 | 87.3 |
| – Strength Index Reading (3 Year Range): | Bullish-Extreme | Bearish-Extreme | Bullish-Extreme |
| NET POSITION MOVEMENT INDEX: | |||
| – 6-Week Change in Strength Index: | -3.8 | 3.5 | 5.7 |
Article By InvestMacro – Receive our weekly COT Reports by Email
*COT Report: The COT data, released weekly to the public each Friday, is updated through the most recent Tuesday (data is 3 days old) and shows a quick view of how large speculators or non-commercials (for-profit traders) were positioned in the futures markets.
The CFTC categorizes trader positions according to commercial hedgers (traders who use futures contracts for hedging as part of the business), non-commercials (large traders who speculate to realize trading profits) and nonreportable traders (usually small traders/speculators) as well as their open interest (contracts open in the market at time of reporting).See CFTC criteria here.
All information and opinions on this website and contained in this article are for general informational purposes only and do not constitute investment advice.

- COT Metals Charts: Speculator Bets led by Copper & Palladium Apr 5, 2026
- COT Bonds Charts: Speculator Bets led by SOFR 1-Month this week Apr 5, 2026
- COT Energy Charts: Bloomberg Commodity Index Speculator Bets Surge Higher Apr 5, 2026
- COT Soft Commodities Charts: Sugar Bets continue higher, Soybean Oil Bets at 5-Year High Apr 5, 2026
- Week Ahead: USDInd braces for slew of risk events Apr 3, 2026
- WTI oil prices surged by 11%, breaking above 111 dollars per barrel Apr 3, 2026
- GBP/USD: Geopolitical Tensions Drive Pound Selling Apr 3, 2026
- Investor optimism remains supported by signals of a possible de-escalation in the Middle East Apr 2, 2026
- USD/JPY – Yen Weakens Amid Geopolitical Uncertainty Apr 2, 2026
- Signs of diplomatic dialogue have appeared in the Middle East – markets reacted positively Apr 1, 2026
Source link