Daily All‑Time‑High Price Action Trading Strategy | Trading Strategy Guides

Every trading day brings a handful of stocks pushing toward fresh peaks.
Some tread water just below their previous high.
Others burst through on a single spike above the line that’s never been taken.
Those breakouts deliver the kind of rapid gains—10 percent, 20 percent or more in one session—that every day trader chases. But to capture that power consistently, you need a straightforward, repeatable plan: scan the right names, enter with precision, manage risk tightly and lock in profits without letting greed get the better of you.
Below is a polished, start‑to‑finish blueprint for the Daily All‑Time‑High Price Action Trade. Read through once, then bookmark it—this is the only guide you’ll need to turn those fresh‑high moments into reliable gains.
1. Why All‑Time High Breakouts Work
At its core, this setup trades one clear reference point: the all‑time high. When price clears that line:
- Holders sit tight. Anyone who bought below the high is suddenly in profit—few rush to sell and give back gains.
- Shorts hit panic mode. Traders betting on a pullback face losses and scramble to cover their positions, which adds to buying pressure.
- New buyers flood in. Algos, funds and momentum traders watch that same level. As soon as it’s taken, they pile on.
That triple‑threat can spark explosive moves: think 10 percent in a few candles, sometimes more. And because the all‑time high is a hard, mechanical level, you can scan for it every morning and run the same rules over and over.
2. Building Your Morning Watchlist
A reliable routine sets up consistent results. Here’s how to organize your scan:
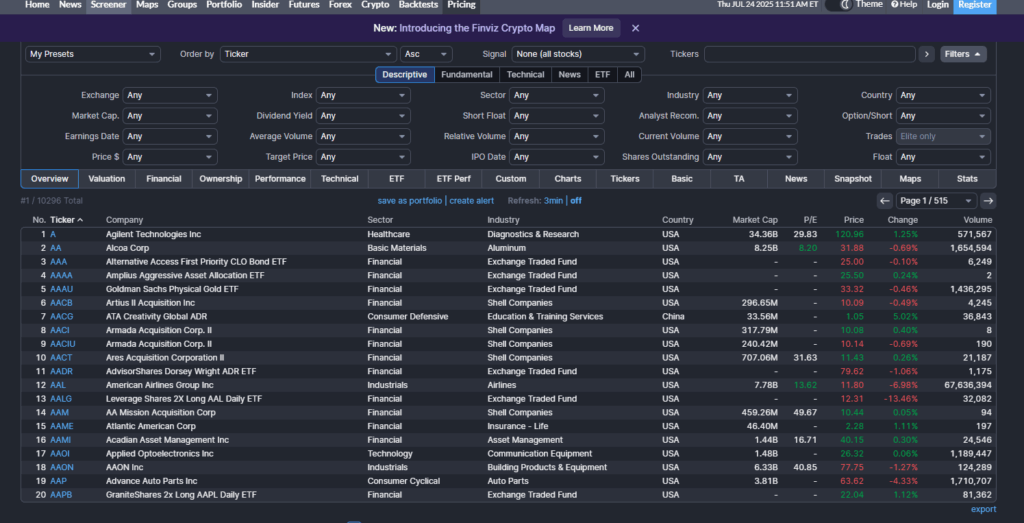
You can do this a few different ways, I am a fan of finviz to do this.
- Group by sector. Build separate watchlists for areas you follow—EV innovators, solar pioneers, AI disruptors, biotech plays, etc.
- Filter by proximity. Look for stocks trading within 5 percent of their all‑time high. If the peak sits at $50, you want names between $47.50 and $50.
- Check volume. Require daily volume at least 75 percent of the 20‑day average. That shows genuine interest near current levels.
- Review key metrics. Ensure daily RSI reads between 40 and 70 (not too weak, not overextended) and that float/liquidity fits your size.
By 9:30 AM, you’ll have a handful of tickers worth a closer look. No more than five—quality over quantity.
3. Confirming the Setup
Before hitting “buy,” run through these chart‑based checks:
- Clean consolidation. Price should have traded in a tight range near the high for at least 5–10 days. That builds tension.
- No overhead supply. Avoid big open gaps or volume clusters more than 10 percent above the high. You want clear air to run.
- Volume profile support. Use a session or daily profile to see where buyers and sellers have been most active.
- Absence of binary events. If earnings, FDA decisions or merger votes are due in the next three days, skip the setup.
If everything lines up, you’re ready to stage your entries.
4. Entering the Trade: Starter and Add
Rather than going all‑in on the first sign of strength, use a two‑step approach:
A. Starter Position
- Risk allocation: Define your total risk (for example, $1 500 per trade).
- Initial buy: Risk 25 percent of that ($375). Place a limit order near the lower end of consolidation (92–95 percent of the high).
- Initial stop: A few ticks below the consolidation low—3–5 percent under your entry.
This small “skin in the game” order gets you moving without blowing your risk budget if the pattern fails.
B. Breakout Add‑On
- Trigger: A decisive candle closing above the all‑time high on volume at least 120 percent of average.
- Second buy: Deploy the remaining 75 percent of risk ($1 125) with a limit order just above the high (0.2–0.5 percent above).
- Stop relocation: Once fully filled, move your stop to just under the all‑time high for breakeven protection.
This two‑tier entry lets you confirm real breakout strength before committing fully.
5. Managing Stops and Scaling Out
Stop‑Loss Discipline
- Never widen stops out of hope. Only tighten or move to breakeven once fully filled.
- Emotional stops = losses. Base every stop move on chart structure (new support levels), not gut feel.
Profit Tiers
- Tier 1: Sell 50 percent of your position at a 10 percent gain from average entry. Locks in quick profit.
- Tier 2: Sell another 25 percent at a 20 percent gain. Captures extended momentum.
- Runner: Let the final 25 percent rip with a trailing stop under successive swing lows or VWAP touches.
Locking in stages keeps you from getting greedy or holding losers.
6. A Day‑In‑The‑Life Example
Meet Trader Sam, who runs this setup every day:
- 8 AM: Sam opens her EV innovators list, filters for price ≥ 95 percent of ATH and volume criteria. Three names pop: $SPARK, $AMP, $DRIVE.
- 9:30 AM: She zeroes in on $DRIVE. ATH at $42. Price has bounced between $40 and $42 for two weeks. Daily RSI sits at 58. No events this week. Check.
- 9:45 AM: She places her starter buy: $375 at $40.50. Stop at $39.50.
- 10 AM: Price dips to the lower channel. Her limit fills. She’s in 9 shares at $40.50.
- 10:30 AM: A high‑volume engulfing candle blasts through $42 on volume 150 percent above average. Alert fires.
- 10:35 AM: Sam adds $1 125 at $42.10 (average now ~$41.90). She moves her stop to $41.95 (just under the old high).
- 11 AM: Price hits $46.10 (10 percent up). She sells half, banks profit and tightens the stop under new $44.50 support.
- 1 PM: Price grinds to $50 (20 percent up). She sells another 25 percent and trails the rest. A reversal back to $48 triggers her trailing stop. She’s out with an 18 percent average gain.
No hunches. No guessing the news. Just one line, two entries, clear stops and tiered exits.
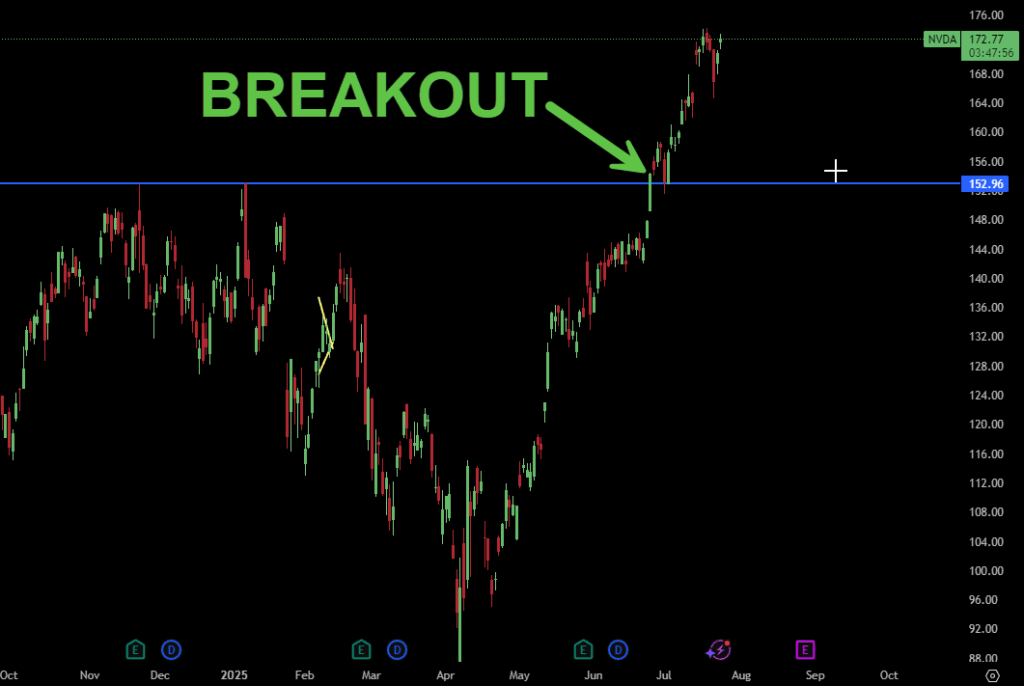
Real‑World Example: NVIDIA’s All-Time High Breakout in 2025
On June 26, 2025, NVIDIA ($NVDA) delivered a textbook all‑time‑high breakout that perfectly illustrates this strategy in action:
- Pre‑breakout consolidation
- For nearly two weeks leading into June 26, $NVDA traded in a tight range just below its prior all‑time high of $152.96.
- Volume during that period showed clear acceptance between $150 and $152, signaling buyers were comfortable at those levels.
- Starter entry near support
- A small starter position taken around $150.50 on a dip into the consolidation floor put our feet in the door with limited risk.
- Initial stop was set just below $149.75—the low of that consolidation zone.
- The breakout trigger
- At the June 26 open, heavy institutional buying sent $NVDA through $152.96 on volume more than 150 percent of its 20‑day average.
- That candle closed decisively above the peak, firing our alert and signaling it was time to add to the position.
- Add‑on and stop relocation
- The remaining allocation was added just above the breakout, around $153.20.
- With the full position in, the stop was moved up to $152.75 (just under the old high) to protect capital.
- Profit taking and runner
- By midday, $NVDA had jumped to $162.25 (+6 percent), so half the shares were sold to lock in gains.
- A second tranche was sold around $168 (+10 percent), and the final runner was trailed under successive intraday swing lows.
- Outcome
- The trade closed out with an 8.5 percent average gain on the day, perfectly capturing the surge from the ATH breakout.
- This NVDA move highlights how clear consolidation into a known high, followed by a strong-volume breakout, can yield fast, reliable profits.
Use NVIDIA’s June 26 example as a template: watch for that tight pre‑break consolidation into the old high, take a small starter, confirm the breakout on volume, then add and manage stops at the former peak.
Rinse and repeat across your watchlist to turn daily all‑time-high moments into consistent edge.
7. Common Mistakes and How to Fix Them
| Mistake | Fix |
|---|---|
| Chasing above the breakout | Use a limit order 0.2–0.5 percent above the high |
| Ignoring weak volume | Require ≥ 120 percent of average volume for confirmation |
| Moving stops on hope | Only move stops based on new structural support levels |
| Overleveraging in craze sectors | Cap risk at 1–2 percent of account size per trade |
| Holding into binary events | Exit before earnings, FDA votes or merger deadlines |
8. Journaling to Sharpen Your Edge
Your best teacher is your own data. Keep a trading log with:
- Ticker & date
- Entries, sizes & stops
- Volume & RSI readings
- Exit prices & timing
- Profit/loss
- One‑line lesson (“Volume faded,” “Stopped at VWAP,” etc.)
Review weekly. Count your win rate, average return, risk‑reward ratio. Tweak one variable at a time until you find your sweet spot.
9. Next‑Level Tweaks
Once you’ve nailed the basics (30–50 trades), consider:
- Tighter consolidation filters. Require 10+ days for bigger pressure builds.
- Sector rotation expansion. Add biotech, commodities or blockchain lists—test each first.
- Option strategies. For accounts that can handle it, liquid call options can amplify gains—just mind implied volatility.
- Automated alerts. Write simple scripts to ping you when price conditions meet your filters.
Only adjust one variable at a time. That way, you know what’s actually moving the needle.
10. Wrapping Up
The Daily All‑Time‑High Price Action Trade boils down to three pillars:
- Scan smart. Focus on price within 5 percent of ATH, clean consolidation and solid volume.
- Enter methodically. Use a small starter, confirm the breakout, then add on strength.
- Manage ruthlessly. Defined stops, tiered exits and no emotion.
When you nail that one reference line—the high nobody has taken before—you tap into predictable human behavior. Holders, shorts and momentum traders all play their part. Your job is to follow the rule set, document every trade, and refine as you go.
Now it’s your turn. Set up your sector lists, fire up the scans, and let those all‑time‑high breakouts guide your entries.
With discipline and repetition, you’ll turn those fleeting moments into consistent edge. Good luck on the next breakout!
Source link