Dash 2 Trade (D2T/USD) Holds Ground, Bullish Rebound Possible
Dash 2 Trade (D2T/USD) has exhibited remarkable tenacity, holding its ground near the $0.001 level despite facing intense selling pressure. Recent price action has consistently gravitated towards this level, solidifying its significance as a key support and resistance area for both buyers and sellers. While the market has experienced short-lived spikes in volatility, it has now settled at the $0.001 price threshold, with four consecutive doji candlesticks forming since the start of trading on October 17th.
Key Levels to Watch:
- Resistance: $0.015, $0.016, and $0.017
- Support: $0.0015, $0.0014, and $0.0013
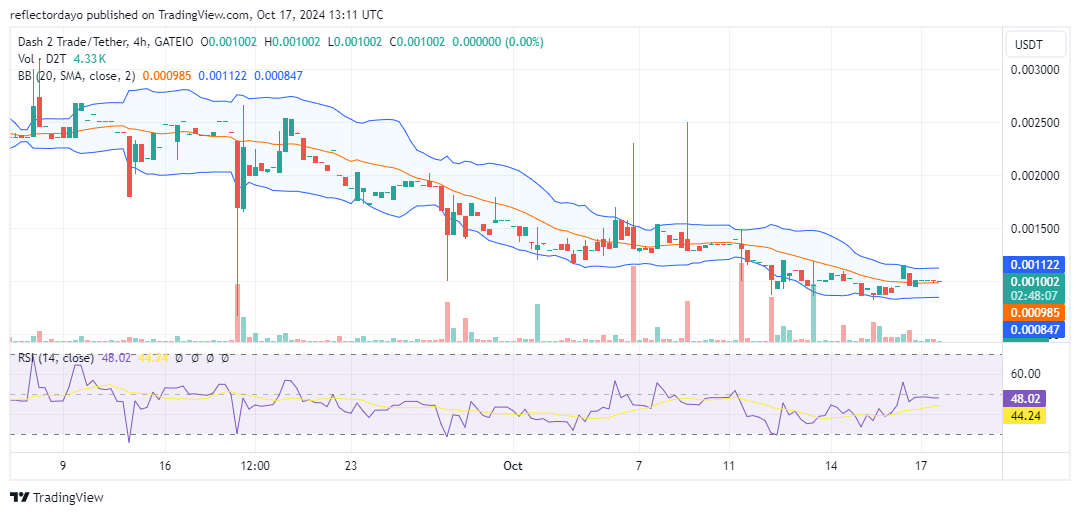
Dash 2 Trade (D2T/USD) Price Analysis: The Indicators’ Point of View
The past four four-hour trading sessions have witnessed a remarkable stability in the Dash 2 Trade (D2T/USD) market, with the price consistently hovering around the $0.001 level. This prolonged period of price stability has made it challenging to accurately predict the market’s next direction.
While these four consecutive doji candlesticks typically signal a market at an equilibrium point, their formation at the current price level suggests that a significant market move may be imminent. Given the market’s downward trend over the longer term, a potential rebound to the $0.0025 level could be anticipated. However, it’s essential to monitor the market closely for any signs of a sustained uptrend to confirm this prediction.
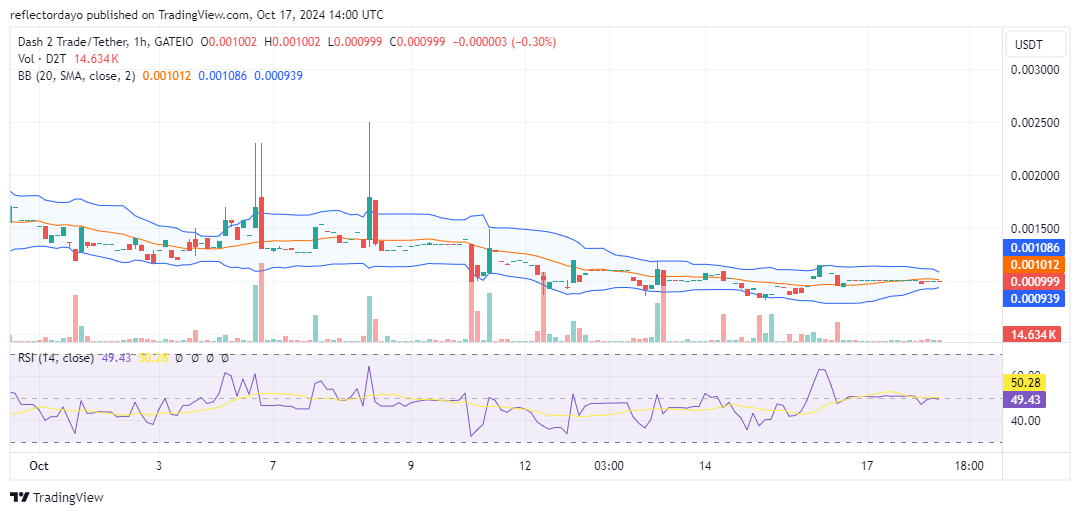
D2T/USD Short-Term Outlook: 1-Hour Chart
The 1-hour chart reveals a persistent price level of $0.001, accompanied by a significant decline in trading volume over the past few sessions. This combination of price stability and reduced volume suggests that the market may be poised for a substantial rally.
Technical indicators are currently signaling a balanced market, with neither bullish nor bearish sentiment dominating. The Bollinger Bands indicator shows the price action moving in tandem with the 20-day moving average, while the two standard deviation bands converge around the horizontally stable price, and the RSI line hovers near the 50 level. This convergence of the bands suggests that the market may be preparing for an imminent upward breakout or rally.
Buy D2T/USD!
Introducing Bundles!📊
Bundles is a new product by Dash 2 Trade that allows you to buy pre-curated collections of tokens organised by category directly from your favourite exchange, in just a few simple steps.
Check it out for yourself!👇https://t.co/YyZQVMKAjv pic.twitter.com/j05AWMgWyX
— Dash 2 Trade (@dash2_trade) May 31, 2024
Dash 2 Trade (D2T) is worth exploring. Buy D2T now!
Source link