Day 3: SMC & ICT Market Structure Explained — BOS, CHoCH & Swing Points (2026) | Trading Strategy Guides
Welcome Back — This Is the One You Can’t Skip
Day 3. If you’ve been following along since Day 1, you now know what ICT and SMC are, where they came from, and the story behind the man who built them. Today we get into the actual trading content — and we’re starting exactly where every serious SMC and ICT trader starts.
Market structure.
Not order blocks. Not fair value gaps. Not liquidity grabs. Market structure first. Because every single other concept in this series sits on top of what you’re about to learn today. Get this wrong, and nothing else works. Get this right, and suddenly the chart starts telling you a story instead of looking like random noise.
Let’s build that foundation.
What Is Market Structure?
At its core, market structure is simply the sequence of swing highs and swing lows that price leaves behind as it moves. It tells you three things in plain terms:
- Is price going up — making higher highs and higher lows?
- Is price going down — making lower lows and lower highs?
- Is price going nowhere — consolidating sideways, building for the next move?
That’s it. Three states. Every market, every timeframe, every asset — it’s always in one of those three phases.
What makes SMC and ICT different from traditional analysis is how they use this structure. It’s not just about identifying a trend. It’s about understanding that every swing high and swing low is a pool of resting orders — stop losses placed by retail traders — that smart money will eventually target.
Defining a Valid Swing Point
Before you can read structure, you need to know what counts as a real swing point. In ICT and SMC, a valid swing high is a three-candle formation where the middle candle’s high is higher than the candles on both sides. A valid swing low is the opposite — the middle candle’s low is lower than both surrounding candles.
Critically: a wick alone does not confirm a structure break. Price must close — full candle body — beyond the previous swing point. A wick through a level is treated as a liquidity sweep, not a structural shift. This one rule alone saves you from a huge number of false signals.
Break of Structure (BOS) — Trend Continuation
A Break of Structure is the market’s way of saying: the trend is still on.
In an uptrend, a BOS is confirmed when price closes above the most recent swing high. In a downtrend, it’s confirmed when price closes below the most recent swing low. It tells you buyers or sellers are still in control and the trend is intact.
 -- Smc Ict Market Structure")
Change of Character (CHoCH) — The Reversal Warning
If BOS says the trend continues, CHoCH says something has changed.
In an uptrend, a CHoCH occurs when price closes below a recent higher low — breaking the sequence that kept the uptrend intact. In a downtrend, it occurs when price closes above a recent lower high. It doesn’t guarantee a full reversal, but it is the market’s earliest signal that the current momentum is weakening and smart money may be repositioning.
A key rule most beginners miss: a valid CHoCH must break the swing that was created by the last BOS — not just any random swing inside the structure. Getting this wrong is the single most common source of misread structure.
Internal vs External Structure — The Layer Underneath
Here’s where SMC adds a layer that most traditional traders miss entirely. Structure actually exists on two levels simultaneously:
External structure — the major swing highs and lows visible on your current timeframe. These define the overall trend direction and are where institutional intent is most clearly expressed.
Internal structure — the smaller swings that form inside each leg of the external structure. These are lower-timeframe movements that can tempt traders into false signals if mistaken for the real trend.
The rule is simple: always define trend from external structure first. Use internal structure only to time your entry. If external structure is bearish and internal structure bounces temporarily higher, the bias stays bearish — you’re looking for sells, not buys.
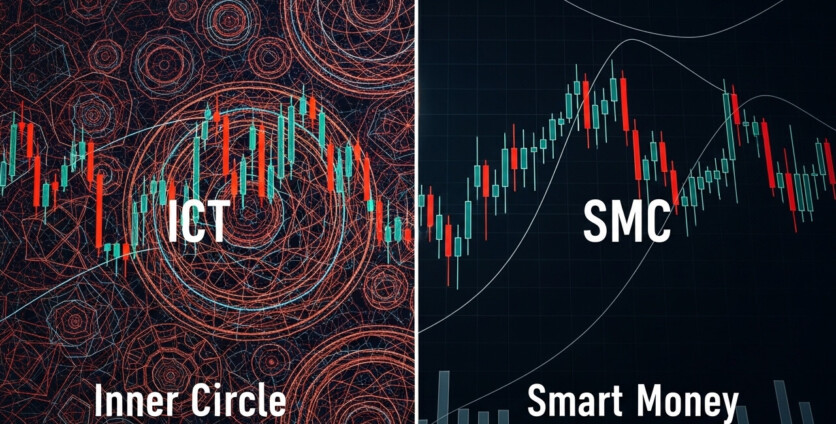
How ICT and SMC Differ on Structure
Both frameworks agree on the fundamentals — higher highs and higher lows for uptrends, lower lows and lower highs for downtrends. Where they diverge is in what they do with it.
ICT places heavy emphasis on the timeframe hierarchy — the daily chart sets the bias, the four-hour or one-hour provides the structural context, and the five-minute or lower is used only for precision entries. Structure on the higher timeframe always wins over what you see on a lower one.
SMC takes a similar approach but gives traders more flexibility — structure principles remain consistent but aren’t locked to specific timeframe combinations the way ICT prescribes. This makes SMC more accessible for traders who want the logic without the rigid timeframe rules.
The One Thing You Must Walk Away With Today
Before you ever look for an order block, a fair value gap, or a liquidity grab — you must know the structural context you’re operating in. Is the market bullish or bearish at the higher timeframe? Has there been a BOS or a CHoCH? Where are the relevant swing points?
Every trade setup we cover in the rest of this series will start with exactly those questions.
Up Next — Day 4
Now that you understand how markets are structured, tomorrow we tackle the single concept that powers all of it: Liquidity. Why does price move the way it does? What is it actually chasing? Day 4 answers that completely — and once you see it, you’ll never look at a swing high or low the same way again.
→ See you on Day 4.