Doji Candlestick Pattern Explained: Key Features & Trading Use

Explanation of Doji Candlestick Pattern
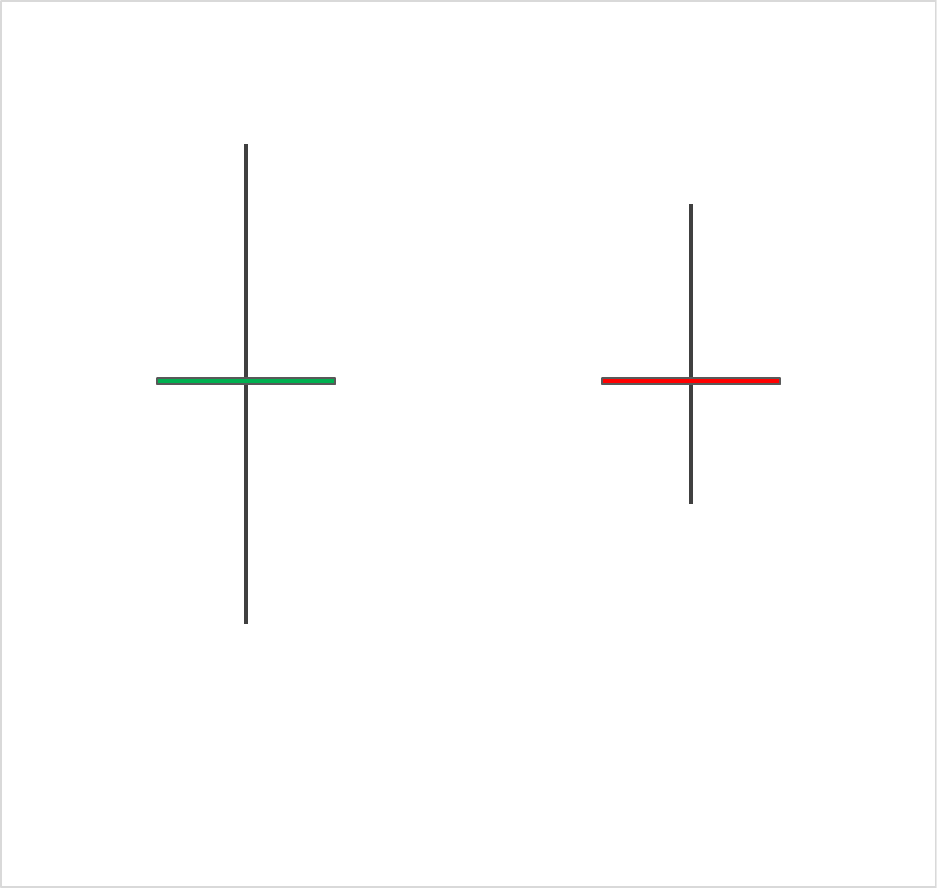
The Doji candlestick pattern is a signal in technical analysis that reflects market indecision. This pattern forms when the opening and closing prices are nearly identical, resulting in a small or non-existent body. The Doji is typically characterized by long upper and lower wicks, signifying that price moved both higher and lower during the session but closed near its opening price. This pattern often signals a potential reversal or pause in the prevailing trend, making it important to monitor subsequent candles for confirmation.
Illustration of Doji Candlestick Pattern
The Doji candlestick pattern is illustrated below:
Image Metadescription Output
: “Illustration of the Doji candlestick pattern, a key signal of market indecision where the opening and closing prices are nearly identical. Often seen as a potential reversal signal, this pattern shows equal pressure from buyers and sellers. Learn more at https://enlightenedstocktrading.com/doji-candlestick-pattern/ and explore more candlestick patterns at https://enlightenedstocktrading.com/candlestick-patterns/. The Doji candlestick pattern is a crucial signal in technical analysis that reflects market indecision. This pattern forms when the opening and closing prices are nearly identical, resulting in a small or non-existent body.”
Key Pattern Features of the Doji Candlestick Pattern
- Very small or non-existent real body (open and close prices are nearly equal).
- Long upper and lower shadows indicate significant price movement in both directions.
- Signals indecision or equilibrium between buying and selling forces.
- Often seen at potential market tops or bottoms, indicating possible trend reversal.
- Requires confirmation from subsequent price action.
Trading Psychology of Doji Candlestick Pattern
The Doji pattern represents a moment of indecision in the market where neither buyers nor sellers gain control. It reflects a balance of power between the two forces, suggesting that the prevailing trend is losing momentum. Buyers are no longer confident enough to push prices higher, and sellers are equally reluctant to drive prices lower. This often leads traders to expect a reversal, though confirmation from the next few candlesticks is essential.
The pattern can lead to reversals because it shows that market participants are unsure about the current trend’s continuation. However, in some contexts, it may result in a continuation if the subsequent price action reasserts the trend.
Conventional Approach to Using Doji Candlestick Pattern
- Market Conditions: The Doji pattern is often associated with reversal signals in trending markets. In an uptrend, it may suggest that bullish momentum is weakening, while in a downtrend, it can imply that sellers are losing control. The pattern tends to perform better in trending markets when it appears after a strong price move. In sideways or consolidating markets, Dojis often highlight short-term indecision without providing a clear signal for future direction.
- Volatility Considerations: In low volatility environments, Dojis can effectively signal a potential reversal. However, in high volatility conditions, Dojis may appear more frequently due to large price swings, leading to more false signals. As such, additional technical analysis or confirmation is typically needed to make the Doji a reliable signal in such markets.
Risk Management Suggestions for Doji Candlestick Pattern
Systematic traders might consider placing stop-losses just below the low of the Doji in a bullish setup or just above the high in a bearish setup. This approach limits risk in case the market moves against the anticipated reversal. However, as with any pattern, backtesting these levels is essential before blindly following conventional wisdom to ensure their effectiveness.
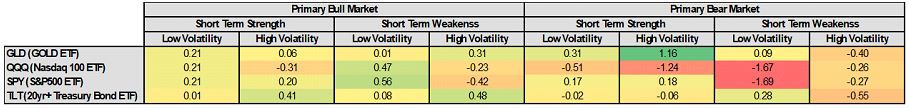
Does the Doji Candlestick Pattern Actually Work?
The following backtest results show the performance of the Doji pattern across different assets for the 5 days following the pattern. Calculations assume entry on the next bar’s open and exit 5 bars later at the open:
Pattern Failure Conditions for Doji Candlestick Pattern
The Doji pattern may fail when:
- It appears frequently in high volatility conditions, generating false signals.
- It does not receive confirmation from the following candlestick. For example, if a Doji appears in a downtrend but is followed by another bearish candlestick, it may signal continuation instead of reversal.
- The market is driven by external events such as news releases, overriding typical technical patterns.
Systematic Trading Application for Doji Candlestick Pattern
A systematic trader could use the Doji pattern as a trigger for entry or exit in a trading system. For example:
- Entry Rule: Enter a long trade when a Doji appears after a downtrend and is followed by a bullish confirmation candle (e.g., a candle with a higher close).
- Exit Rule: Exit the position when the price closes below the low of the Doji’s confirmation candle or when a predetermined profit target is reached.
As always, backtesting is crucial. Not all candlestick patterns work well in all markets or conditions, so it’s important to verify their reliability in your chosen market before using them in a live trading environment.
Amibroker Code for Doji Candlestick Pattern
// Amibroker AFL code to identify the Doji candlestick pattern
doji = abs(O – C)
Links to Articles About Other Candlestick Patterns
Explore more candlestick patterns and enhance your trading strategy! Visit our Ultimate Candlestick Pattern Guide or explore individual patterns below:
- Doji
- Hammer
- Inverted Hammer
- Bullish Engulfing
- Bearish Engulfing
- Morning Star
- Evening Star
- Shooting Star
- Hanging Man
- Piercing Pattern
- Dark Cloud Cover
- Three White Soldiers
- Three Black Crows
- Dragonfly Doji
- Gravestone Doji
- Spinning Top
- Marubozu
- Tweezer Top
- Tweezer Bottom
- Bullish Harami
- Bearish Harami
- Rising Three Methods
- Falling Three Methods
- Bullish Abandoned Baby
- Bearish Abandoned Baby
- Bullish Kicker
- Bearish Kicker
- Three Inside Up
- Three Inside Down
- Upside Gap Two Crows
- Mat Hold
- Upside Tasuki Gap
- Downside Tasuki Gap
Discover the 10 most important lessons from 18 years of profitable trading & reading over 150 trading books.

Get your FREE Report & 10 Training Videos NOW!
Source link