Using Edgeful as an Options Trader
In a previous article, we discussed how Edgeful.com can provide an edge to day traders in assets such as stocks, cryptocurrencies, forex, and futures.
Today, we continue by discussing how even options traders can utilize Edgeful.
Certain option strategies move with the price of the underlying assets.
Therefore, if you have an edge in the direction of the underlying assets (whether in stocks or futures), you also have an edge in the corresponding options position.
Contents
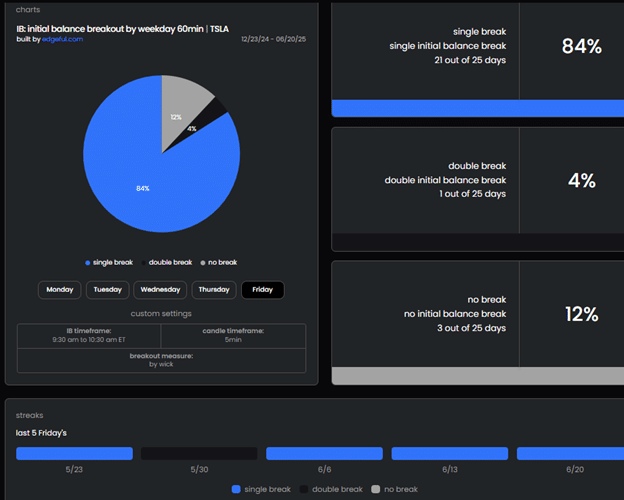
Below we see the “initial balance breakout” statistics for the trailing six months of TSLA stock:
The initial balance (IB) is configured to be the “one hour” at the start of the regular trading hour session.
We have also configured to show us statistics for only Friday’s trading session (because TSLA only has Friday expirations).
84% of the time, the price will break out to one side of the IB.
Only 4% of the time will it break on both sides.
It further shows that in the last five Fridays, TSLA broke on both sides only once.
Therefore, a potential trading strategy is to wait for the IB to break on one side.
This gives us the directional bias.
Then sell a credit premium on the other side.
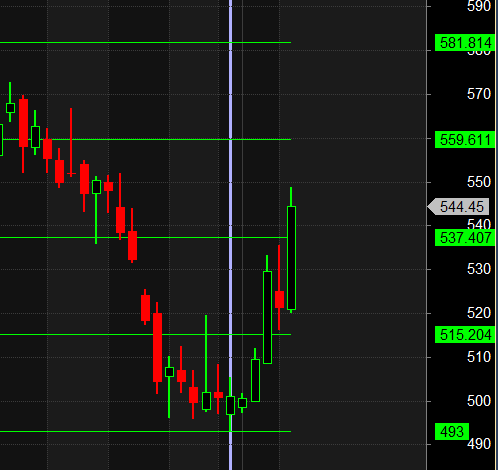
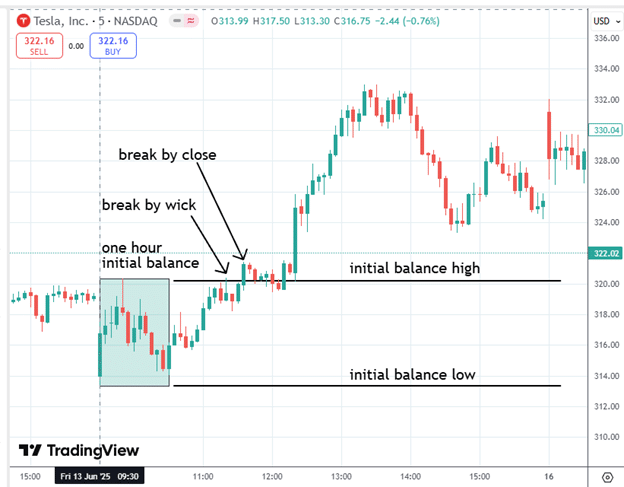
A 5-minute chart of TSLA may help:
I have manually shaded the one-hour initial balance at the start of the June 18, 2025, regular trading session.
When you subscribe to Edgeful, you will get custom TradingView indicators that will highlight the IB for you on your TradingView charts.
At 10:30 am New York time, the initial balance high and the initial balance low are established.
At 11:20 am, the initial balance high is broken by a wick. At 11:35 am, it is broken by a 5-minute candle close.
The report can be configured to be “break by wick” or “break by close” and by candle timeframe.
Once the IB high is broken, we have a bullish bias for TSLA for the day, and it is unlikely (4% chance) that a double break would occur.
That is, we do not expect the price to break the initial balance low.
We could consider selling a put spread below the initial balance low, say at $310.
However, a $310/$300 bull put spread is picking up too little credit, $0.12, for a 10-point wide risk.
Since the $310 strike is at the 6-delta, there is not enough credit to sell.
Therefore, we have to sell higher strikes.
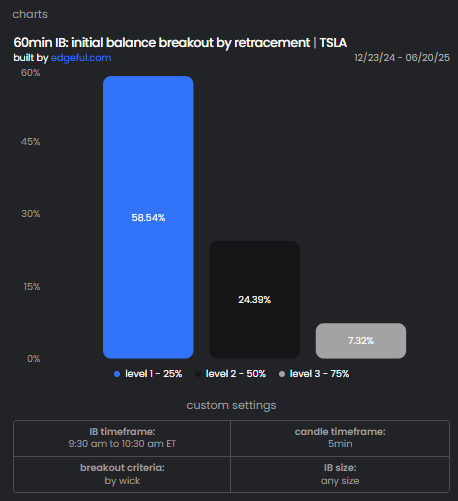
Another report shows that after a break to the upside, the price is likely (58.54% chance) to retrace 25% back into the initial balance:
However, it is unlikely (a 24% chance) that it will retrace to half of the initial balance.
Therefore, it is a calculated risk to sell at the midpoint of the IB with the $317.50 put option and buy the $315 put.
This results in a net credit of $0.48 per contract for this bull put spread, with a risk-to-reward ratio of 4-to-1.
For each loss, we need four wins to break even.
Based on the statistics, only one out of every four will return to our short strike.
But a retreat to the short strike does not mean that it will expire below it.
It appears that the trade has an edge, albeit a thin one.
If this is not a big enough edge for the trader to take, he can check if other stocks have better odds in Edgeful’s “Scanner” dashboard.
In our example, looking at the price chart, this bull put spread would expire worthless at the end of the day, and we would retain the credit of $48.
Suppose you don’t have time to sit at the computer to watch for a break of the initial balance.
The “SMA Performance” report might be for longer-term traders.
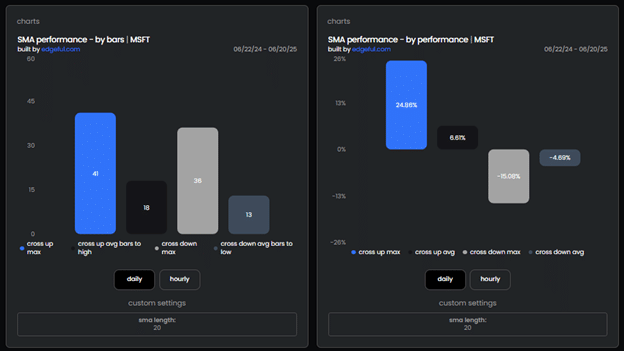
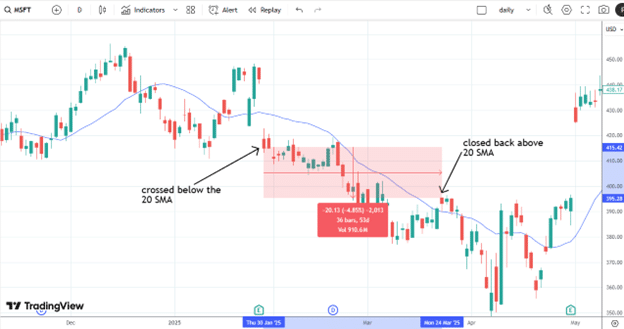
Here is one on Microsoft (MSFT) giving the stats for the 20-period simple moving average (SMA) crossover on the daily chart:
It says that when the price of MSFT closes and crosses below the 20-SMA, it takes on average 36 candles (36 days) before the price gets back above the 20-SMA:
During that time, it would experience on average a 4.69% price drop to the bottom before coming back up.
And it would typically take about 13 days to reach that bottom.
If this is longer or shorter than your desired trading timeframe, you can configure the report to display work with the 8-SMA or the 200-SMA, using either daily or hourly candles.
Edgeful gives useful statistics to structure an options trade.
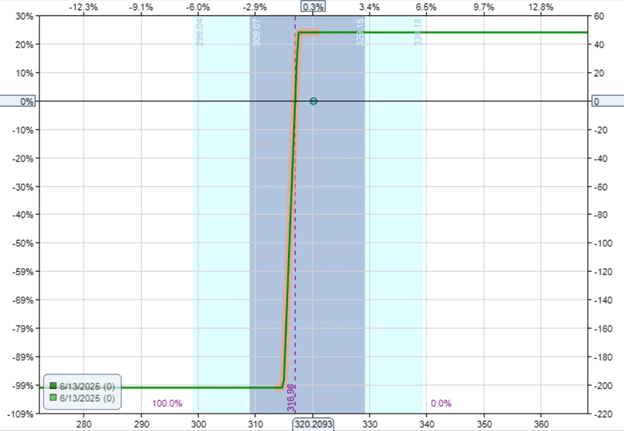
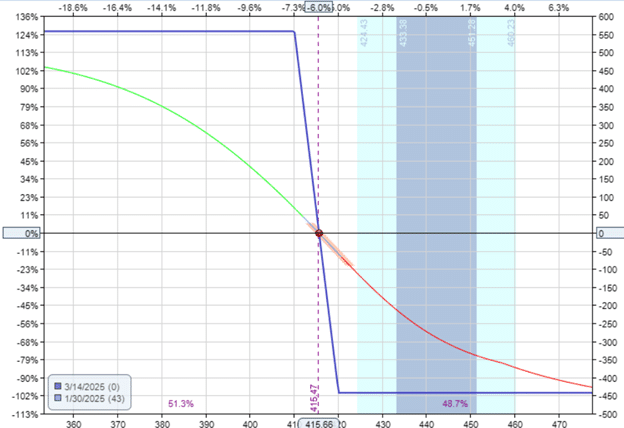
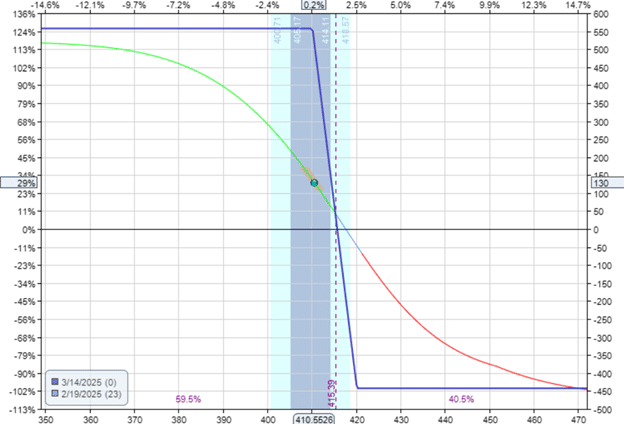
For example, consider a bear put spread on MSFT with 43 days to expiration, entered on January 30, 2025 (the day after the close below the 20-SMA).
If the trade was exited 13 days later on February 19, it would make a profit of $130
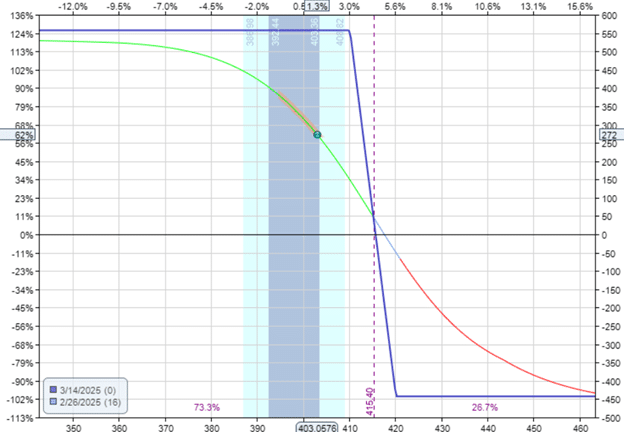
Alternatively, we could target a 4.69% price drop, which would occur if MSFT fell to $396, as it did on February 26.
If the trade had been closed then, the profit would have been $272.50:
A good stop-out point would be when the price returns above the 20-SMA.
Edgeful offers a variety of reports.
By examining the various reports, we can develop our own strategy.
Let’s look at one last example.
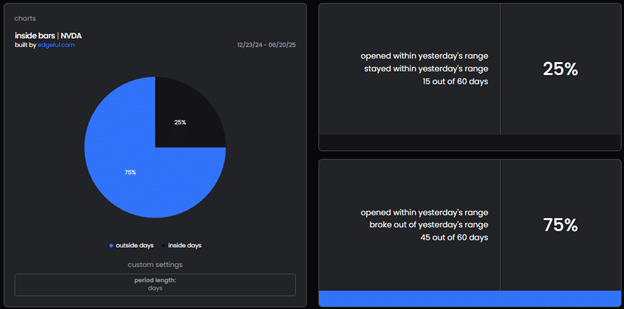
Here, we see that if NVDA opens within yesterday’s range, it will likely (75% chance) break out of that range on either the upside or the downside.
This is typical of many stocks, because inside days are rare.
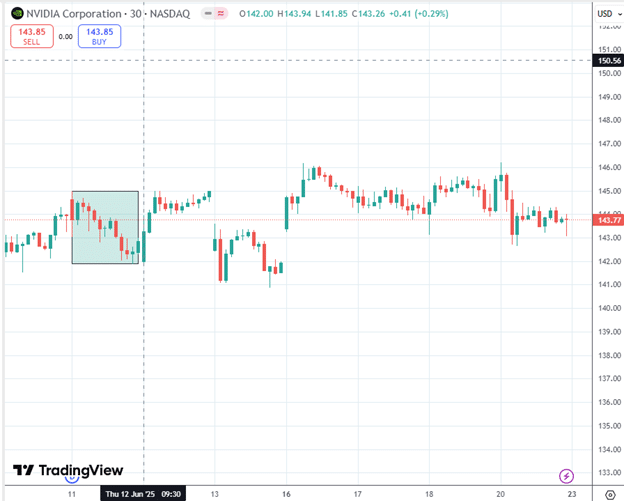
On June 12, 2025, NVDA opened within yesterday’s range (highlighted in green):
These are 30-minute candles.
And the opening candle at 9:30 EST is bullish.
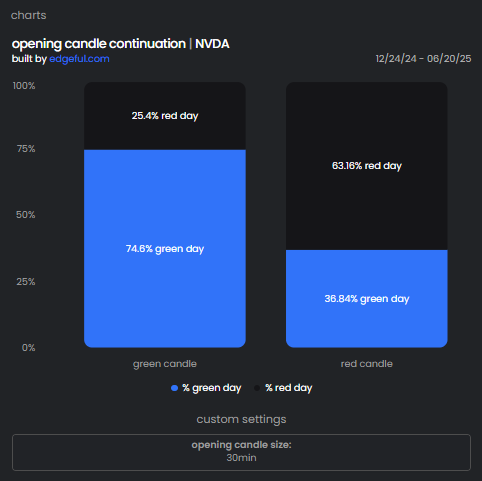
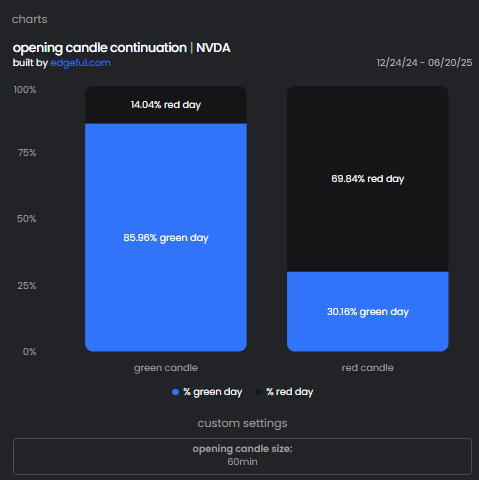
The “opening candle continuation” report suggests that if the opening candle is green:
Then there is a 75% chance that the day’s session will be green.
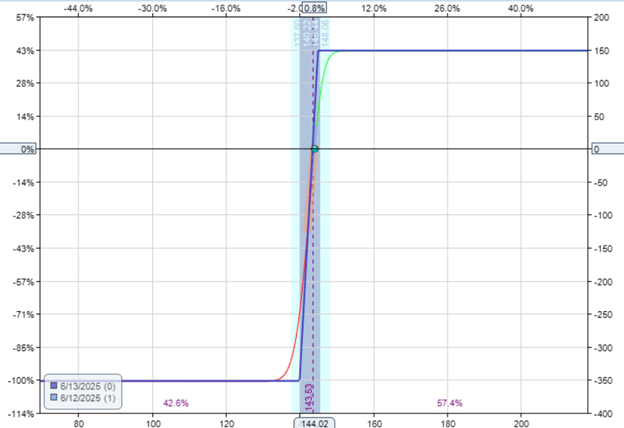
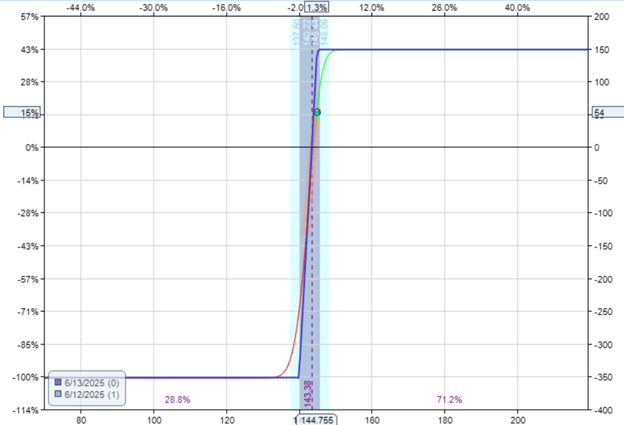
Therefore, NVDA has a bullish directional bias on this day, where a trader can enter a bull call spread for the coming Friday’s expiry:
This pattern is a day pattern, so the trader closes the spread at the end of the day’s session (even though the spread has not expired yet).
Nevertheless, the trader was able to capture $54 of profits:
$54 from a $350 max risk is a 15% return.
Perhaps, this strategy would work even better if we made the opening candle size one hour instead of 30 minutes.
How can we tell?
Configure the opening candle size to be 60 minutes and see:
The statistics are even stronger – 86% versus 75%.
Edgeful provides you with statistics, enabling you to trade based on data rather than emotion.
Use the data to tell you when to enter, when to take profit, and when to stop out.
While it is true that most of its reports are geared towards day-trading strategies on stocks, forex, crypto, and futures, there are a few that may be useful for swing traders as well.
For options traders, having an edge on the underlying assets is equivalent to having an edge in the options trade.
We have seen a few examples using various days to expiration.
There are many ways to extract money from the market.
Some find an edge in reading price action. Some find an edge in the detailed study of an indicator.
And others find edge using Edgeful statistics and live data to tell them the probabilities of how an asset moves under given conditions at given times.
We hope you enjoyed this article on using Edgeful for options trading.
If you have any questions, send an email or leave a comment below.
Trade safe!
Disclaimer: The information above is for educational purposes only and should not be treated as investment advice. The strategy presented would not be suitable for investors who are not familiar with exchange traded options. Any readers interested in this strategy should do their own research and seek advice from a licensed financial adviser.
Source link