How to Trade Fair Value Gaps: Candlestick Pattern Explained

Fair value gaps are one of the most reliable intraday patterns for timing entries – if you know how to identify the valid ones.
Most traders learn the basic three-candle definition but fail to understand why 80% of fair value gaps don’t work.
They see every gap as a trading opportunity, then wonder why their entries keep getting stopped out.
The difference between profitable FVG trading and constantly losing money comes down to context.
In this guide, I’ll show you exactly how to identify high-probability fair value gaps, when they actually work, and how to use them for timing options entries.
Contents
What Is A Fair Value Gap?
A fair value gap (FVG) is a three-candle pattern where the first candle doesn’t overlap with the third candle, creating a price zone where minimal trading occurred.
The basic structure:
- Candle 1: Establishes the initial move
- Candle 2: Creates the gap (typically a strong directional candle)
- Candle 3: Doesn’t overlap with Candle 1’s range
Why it matters: Fair value represents price levels where significant transactions occur between buyers and sellers.
A gap means there was decreased transaction volume at that level.
Buyers or sellers were absent, causing price to skip through that zone quickly.
When price returns to the gap, it enters a zone where one side was previously absent.
This often causes reversals as those absent participants finally engage.
Gap status terminology:
- Unfilled/Unmitigated gap – Price hasn’t returned to the gap yet (most powerful)
- Partially filled/Mitigated gap – Price entered the gap but didn’t close through it
- Invalidated gap – Price closed completely through the gap
How To Identify Bullish Fair Value Gaps
A bullish FVG signals potential upside support when price returns to fill the gap.
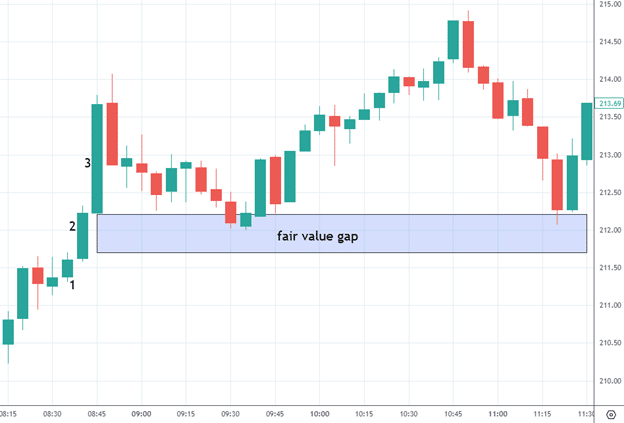
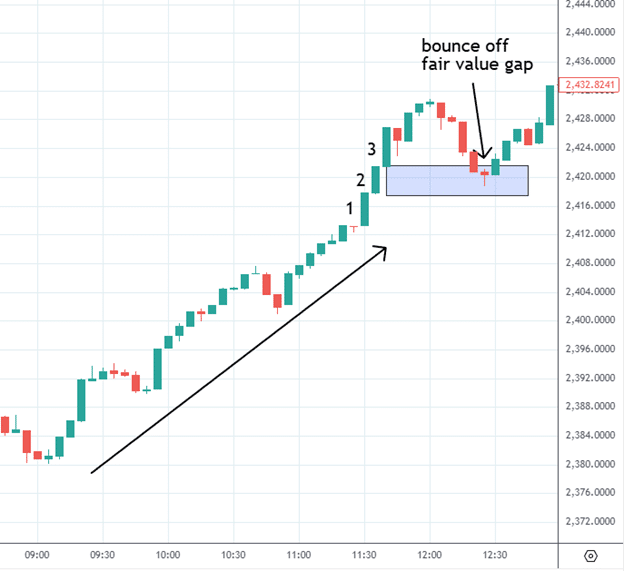
Example: Oracle 5-Minute Chart
Candles 1, 2, and 3 form a bullish fair value gap:
- Candle 1 high: $211.70
- Candle 3 low: $212.23
- Gap zone: $211.70 to $212.23 (no overlap)
What makes it valid:
The strong middle candle (Candle 2) indicates buyers aggressively pushed price higher, leaving sellers behind.
When price returned to the gap (blue zone), buyers defended it twice – the gap acted as support.
Key characteristics of high-quality bullish FVGs:
- All three candles are bullish (green)
- The middle candle is long-bodied (strong momentum)
- The gap forms during an uptrend or bullish momentum
- First candle shows conviction (not a weak doji)
The first return to the gap works best.
Like support and resistance, gaps weaken with repeated tests.
How To Identify Bearish Fair Value Gaps
A bearish Fair Value Gap signals potential downside resistance when price returns.
Example: Nvidia 5-Minute Chart
Note how it acted as resistance as price came back into the gap.
The logic: The strong downward move of Candle 2 suggests desperate sellers or high selling volume.
Not all sellers got their orders filled during the initial drop.
When price returns to the gap, those remaining sell orders execute, pushing price down.
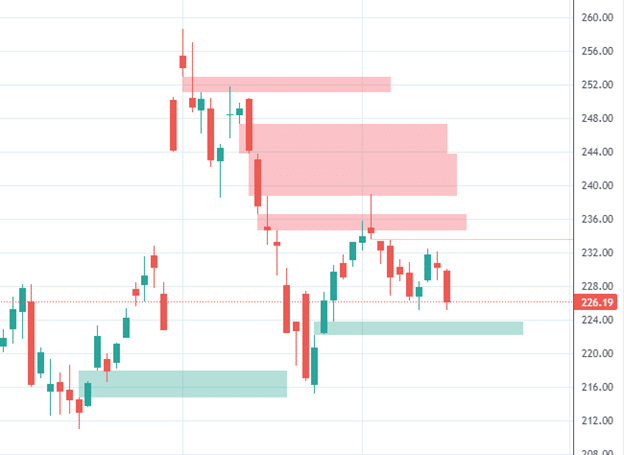
Multiple Gaps in Close Proximity
The observant will note that there is another fair value gap above the first one:
This is true.
The trader can monitor both gaps.
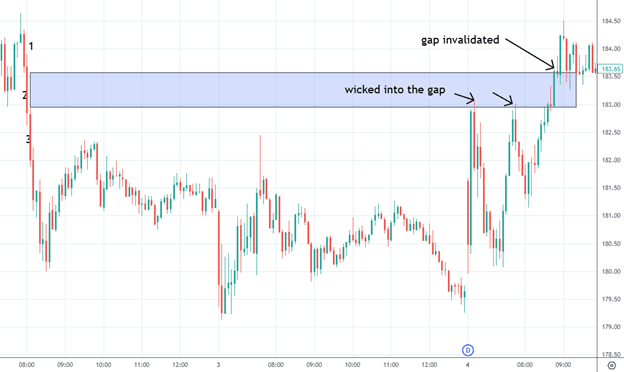
If we look across multiple days, we see that price does encroach upon the gap:
But as it touches the gap multiple times, the gap gets invalidated with a close above it.
Key insight: When enough sellers have sold and fewer sellers are left, buyers become strong enough to push through the gap.
This is why repeated tests weaken gaps – the order flow imbalance gets absorbed.
Extended Fair Value Gaps
When there are two fair value gaps next to each other, the trader can mentally consider the two gaps as one big gap.
Strictly speaking, a fair value gap is formed by one middle candle.
But if you think of the gap as a displacement of price from one area of fair value to another, then this displacement can be formed by two stacked candles – an “extended displacement.”
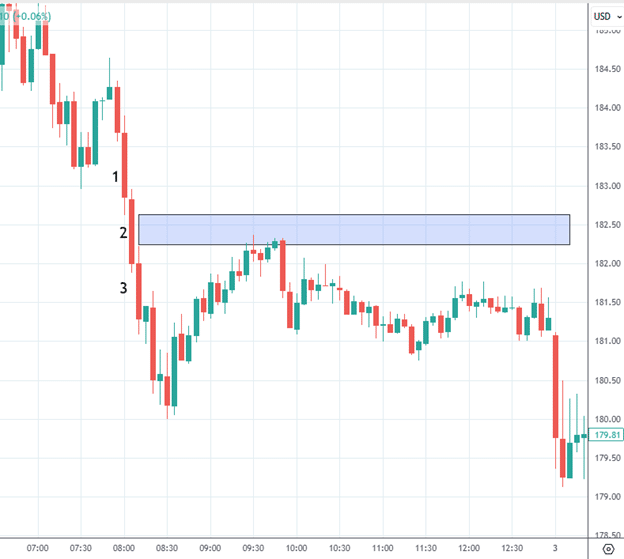
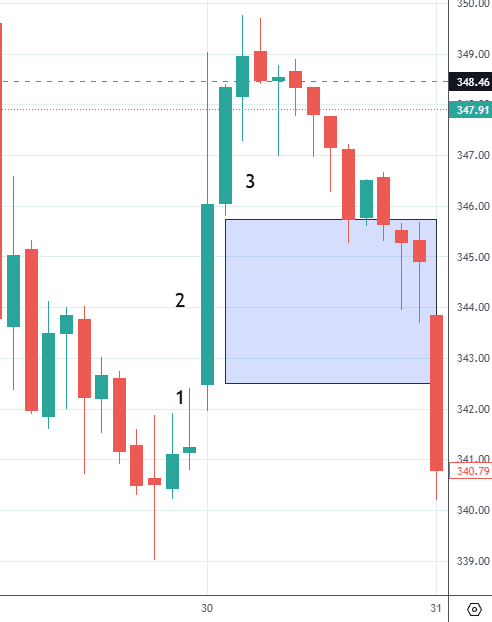
Example: S&P 500 30-Minute Chart – November 20, 2025
In this chart, we see two candles that look like one long candle if you stack them together.
A trader might consider this highlighted area as a gap in fair value.
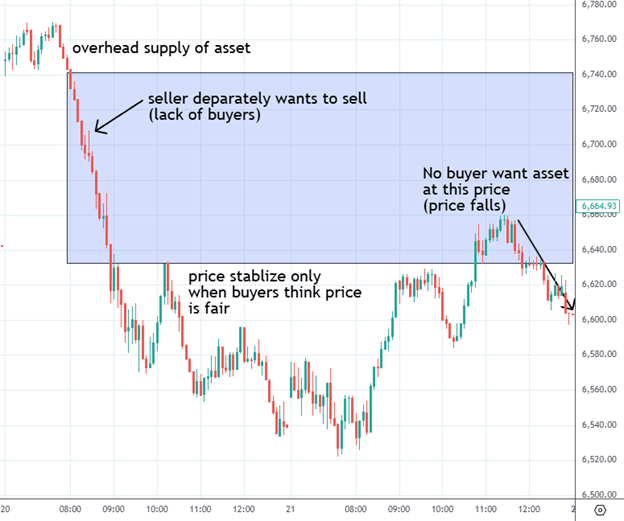
In order for two such large red candles to form back-to-back, there must be a lot of strong sellers desperately wanting to sell and very few buyers willing to buy.
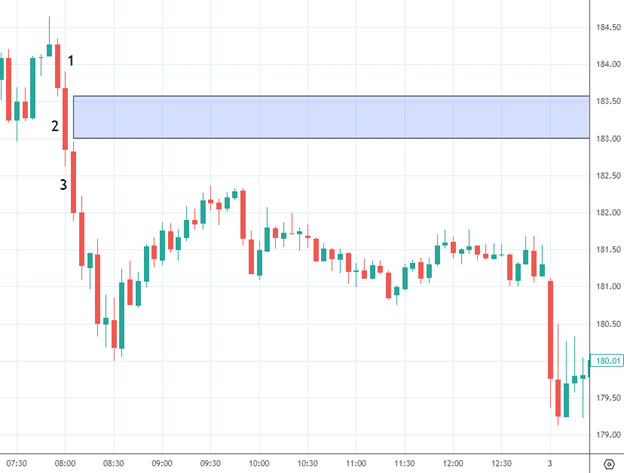
Zooming In for Detail
When we zoom in to look at the 5-minute chart in that exact same area, we see this more clearly:
There could be an oversupply of assets at the top of the gap – sellers willing to lower the price to sell the assets.
But there are no buyers.
So sellers have to keep dropping their prices.
This forms the gap in fair value.
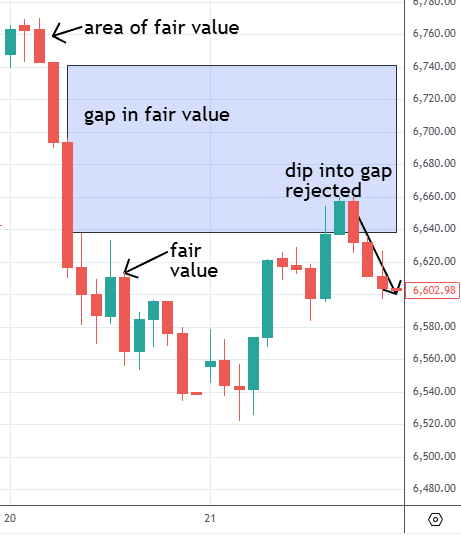
The gap represents an area where there is little transaction because market participants do not think price is fair at those levels.
Only when the price comes down enough for buyers to show up do we return to fair value.
The gap is when price transits from one area of fair value to another.
When price re-enters the gap, it returns to a zone where buyers previously showed little to no interest.
As a result, the lack of buying pressure often causes prices to fall.
This is why we see the gap acting like resistance, causing the price to reverse down into the close of session.
When Fair Value Gaps Work Best
Not all FVGs are created equal.
Context determines success.
1. Within a Larger Trend
Fair value gaps work significantly better when aligned with the higher timeframe trend.
Example: Russell 2000 (RUT) 5-Minute Chart
This bullish FVG occurred within a larger uptrend.
The gap reinforced the prevailing direction, making it more reliable as support.
Rule: Look for bullish FVGs in uptrends, bearish FVGs in downtrends.
Counter-trend gaps fail more often.
2. Fresh, Unfilled Gaps
The first time price returns to an unmitigated gap is the highest probability setup.
Each subsequent test weakens the gap (as we saw in the NVDA example).
3. Strong Middle Candle
A long-bodied middle candle indicates conviction.
Weak, indecisive middle candles produce weak gaps that fail quickly.
When Fair Value Gaps Fail
Knowing when NOT to trade FVGs is as important as identifying them.
1. In Range-Bound, Choppy Markets
FVGs do not work as well in a trading range.
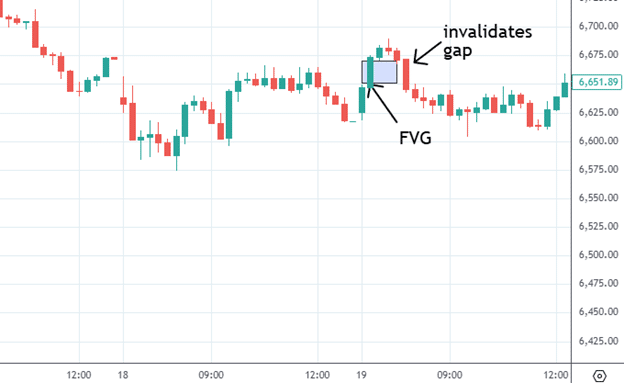
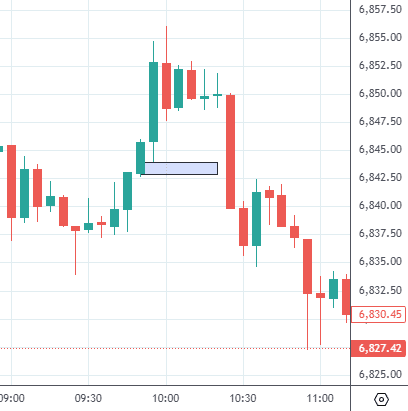
Example: S&P 500 30-Minute Chart
Here we see a bullish fair value gap highlighted in blue.
Note the price action that came before it – it’s in the midst of a noisy trading range.
Hence, this gap didn’t work too well because it was quickly invalidated by the red candles that came later.
Why it failed: No clear trend meant no follow-through when price returned to the gap.
Invalidation rules:
- A bullish fair value gap is invalidated when price drops through the gap and closes below it
- A bearish fair value gap is invalidated when price goes up through the gap and closes above it
2. When Wicks Overlap (Not a Valid FVG)
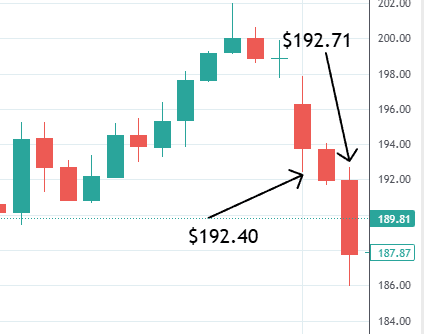
Example: Invalid Fair Value Gap Pattern
In the above chart, the three red candles do not form a fair value gap because candle one and candle three have overlapping prices – the wicks count.
This is a critical distinction.
Many beginners only look at candle bodies and miss that wicks must also not overlap for a valid FVG.
3. Gaps That Are Too Small
Small fair value gaps are less useful.
Example: S&P 500 5-Minute Chart
While that gap meets the technical definition of FVG, it’s too small and is quickly invalidated by the big red candle.
Guideline: Skip gaps smaller than 0.5% of the stock price on 5-minute charts, 1% on 30-minute charts.
4. Weak Initial Candle
The first candle must show directional conviction.
Example: Weak Bullish Fair Value Gap
This bullish fair value gap doesn’t work very well because the initial first candle is very weak with a topping tail wick.
It doesn’t indicate strong buyers.
A strong first candle should have minimal wicks and a full body showing committed directional movement.
How To Trade Fair Value Gaps
Here’s the step-by-step process:
Step 1: Identify the Gap
- Three-candle pattern with no overlap between Candle 1 and Candle 3 (including wicks)
- Preferably all candles in same direction
- Strong middle candle
Step 2: Confirm Context
- Is there a clear trend on the higher timeframe?
- Is this the first time price is returning to the gap?
- Is the market in a range or trending?
Step 3: Wait for Price to Return
Don’t trade the gap when it forms – wait for price to return to test it.
Step 4: Entry Trigger
- For bullish FVG: Enter long when price touches the gap and shows rejection (bullish candle forms)
- For bearish FVG: Enter short when price touches the gap and shows rejection (bearish candle forms)
Step 5: Stop Placement
- Bullish FVG: Stop just below the gap zone
- Bearish FVG: Stop just above the gap zone
Step 6: Profit Target
- Next major support/resistance level
- Previous high/low
- 2:1 or 3:1 risk-reward ratio
Step 7: Exit Rules
- Take profit at target
- Exit if gap gets invalidated (price closes through it)
- Trail stops if strong momentum continues
Using FVGs For Options Entry Timing
Fair value gaps are excellent for timing options entries, but most traders miss this application.
For Directional Trades:
When a bullish FVG holds as support, it’s a high-probability signal for:
When a bearish FVG holds as resistance:
Expiration Selection:
FVGs work best on intraday timeframes (5-min, 15-min, 30-min).
For options:
- Use 0-3 DTE options for intraday FVG trades
- Use 7-14 DTE if trading FVGs on hourly charts
- Avoid using FVGs for longer-dated positions
Strike Selection:
- Enter ATM or slightly ITM for directional conviction
- Use OTM spreads if the FVG is your confirmation (not primary signal)
Position Sizing:
FVGs provide tight stop placement, so you can size positions appropriately:
- Calculate risk: Stop distance × 100 (per contract)
- Risk 1-2% of account per FVG trade
- Size accordingly
Fair Value Gap Indicators
While discretionary traders can spot FVGs manually, indicators help identify them systematically.
The daily chart simply has too many overnight gaps and not enough three sequential directional candles as in the intraday charts.
This is why all the examples in this guide use intraday timeframes – these patterns are more easily found and acted upon by intraday trading.
Any quant can code a bot to trade fair value gaps, and there are indicators that can spot them automatically.
Popular FVG Indicator: LuxAlgo on TradingView
This indicator automatically highlights FVG zones on charts.
Features:
- Automatically marks bullish and bearish gaps
- Shows mitigation status (filled vs unfilled)
- Customizable gap size filters
However: Not every FVG flagged by indicators works.
The discretionary trader’s advantage is understanding context – which gaps to trade and which to skip based on:
Additional Confluence Tools:
Combine FVG analysis with:
- Volume profile (is there volume support at the gap?)
- Order flow/depth of market (are buyers/sellers actually there?)
- Heat maps showing order concentrations
- Volume by price profiles for confirmation
Frequently Asked Questions
Q: How reliable are fair value gaps?
Fair value gaps in proper context (trending markets, first fill, strong middle candle) have roughly 60-70% success rates.
In choppy, range-bound markets, success rates drop to 40-50%. Context is everything – don’t trade every gap you see.
Q: What timeframe is best for trading FVGs?
Fair value gaps work best on intraday timeframes: 5-minute, 15-minute, and 30-minute charts.
Daily charts have too many overnight gaps and fewer clean three-candle sequences.
The 5-minute chart offers the most opportunities for active traders.
Q: Can fair value gaps be used for swing trading?
Yes, but with limitations.
FVGs on 4-hour or daily charts can work for swing trades, but you’ll find far fewer valid setups.
The pattern is most effective for intraday trading where clean directional moves are more common.
Q: How do you know when a fair value gap has failed?
A bullish FVG fails when price closes below the entire gap zone.
A bearish FVG fails when price closes above the entire gap zone.
Additionally, gaps that get tested 3+ times tend to lose effectiveness even if not technically invalidated.
Q: Should I trade every fair value gap I see?
Absolutely not. Most FVGs fail.
Only trade gaps that meet these criteria: (1) within a clear trend, (2) first time being tested, (3) strong middle candle, (4) not too small, (5) conviction in initial candle.
Skip everything else.
Q: How do fair value gaps differ from regular support and resistance?
Fair value gaps are temporary zones based on recent price action and order flow imbalances.
Traditional support and resistance are established over longer periods through multiple tests.
FVGs are more dynamic and short-lived, while S/R levels persist longer.
Q: Can I use fair value gaps with options trading?
Yes! FVGs provide excellent entry timing for short-dated options (0-7 DTE).
The tight stop placement allows for defined risk, and the quick moves that follow valid FVG tests suit options’ time decay profile.
Use FVGs as confirmation for directional options trades or spread entries.
Key Takeaways
Fair value gaps are powerful for intraday trading when used correctly:
✓ Focus on context – Only trade FVGs within larger trends
✓ First fill is best – Subsequent tests have lower success rates
✓ Quality over quantity – Skip small gaps and choppy market gaps
✓ Check for overlap – Wicks count! Candle 1 and 3 must not overlap at all
✓ Use tight stops – The gap edge provides clear invalidation points
✓ Perfect for options – Short-dated directional trades benefit from FVG timing
The pattern itself is simple.
The skill is knowing which gaps to trade and which to ignore.
That discretion separates profitable traders from those who blow up chasing every pattern they see.
Want to Master Technical Analysis for Options Trading?
Fair value gaps are just one tool for timing options entries.
If you’re serious about using technical analysis to improve your options timing:
Options Income Mastery: Learn systematic approaches to options income trading with proper entry timing and risk management ($397)
The Accelerator Program: Advanced training covering technical analysis, position management, and systematic trading strategies ($997)
Related Articles
We hope you enjoyed this article on fair value gaps.
Trade safe!
If you have any questions, please send an email or leave a comment below.
Disclaimer: The information above is for educational purposes only and should not be treated as investment advice. The strategy presented would not be suitable for investors who are not familiar with exchange traded options. Any readers interested in this strategy should do their own research and seek advice from a licensed financial adviser.

Source link