How to Use Fibonacci Retracements for Smarter Trade Entries
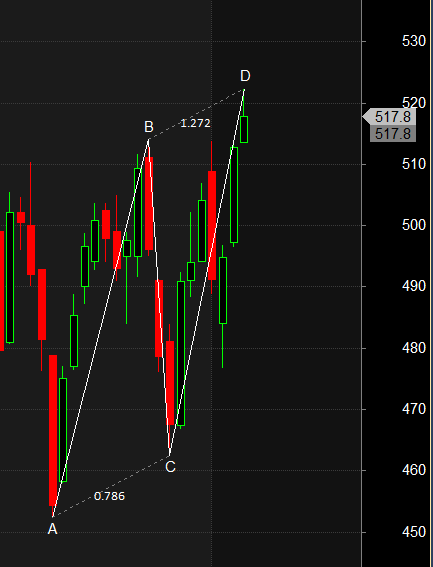
Fibonacci retracements are calculated by identifying the high and low points in a price move and then applying the Fibonacci ratios (23.6%, 38.2%, 50%, 61.8%) between these points. These percentages indicate where price corrections are likely to occur, acting as potential support and resistance levels.
For example, the price might rise from $100 to $150 during an uptrend. Using the Fibonacci retracement tool, traders obtain levels like $138.2, $130.8, and $116.6 as potential support zones. Traders watch these levels to determine entry and exit points for buying, assuming the price will bounce back to its previous trend.