FibroWave 123 Breakout Indicator MT4 – Free Download
Introduction
Technical analysis is pivotal in forex trading, and tools like the FibroWave 123 Breakout Indicator aim to simplify the identification of market opportunities. This article delves into the features, strengths, and limitations of this indicator, designed to detect versatile 123 chart patterns.
Technical Specifications
Version: 1
Year of issue: 2025
Working pairs: Any
Recommended timeframe: Any
Minimum Deposit: Any
Average of account: 1:30 To 1:1000
Best Brokers List
FibroWave 123 Breakout Indicator System works with any broker and any type of account, but we recommend our clients use one of the top forex brokers listed below:
GoldSecure EA Settings
What Is the FibroWave 123 Breakout Indicator?
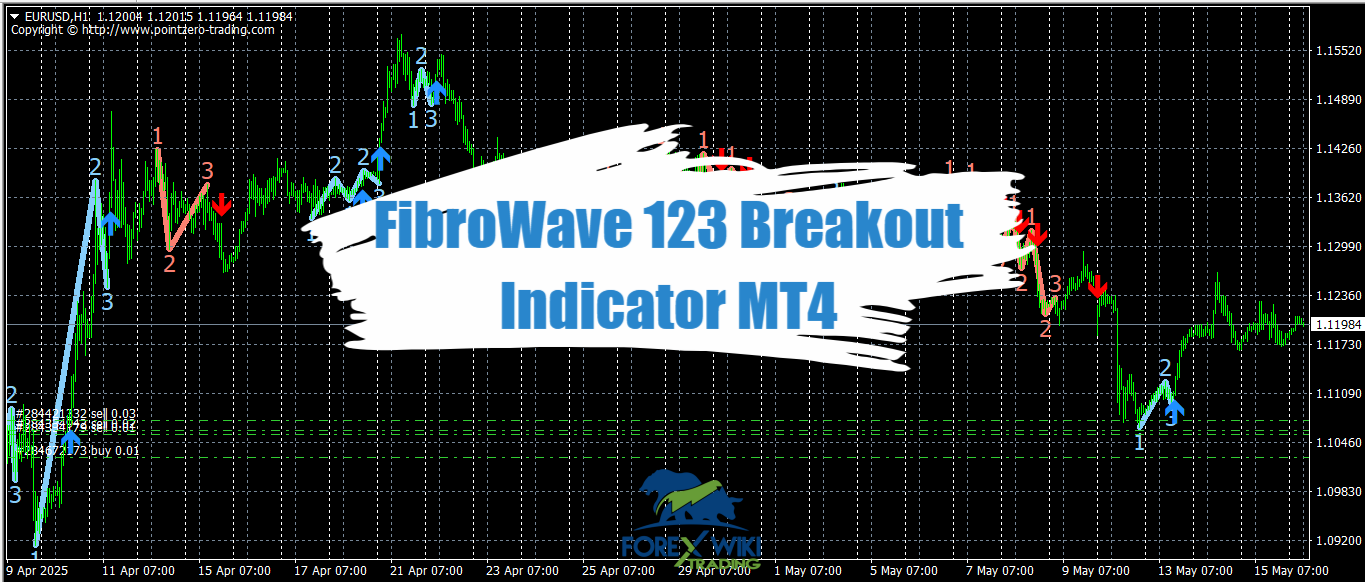
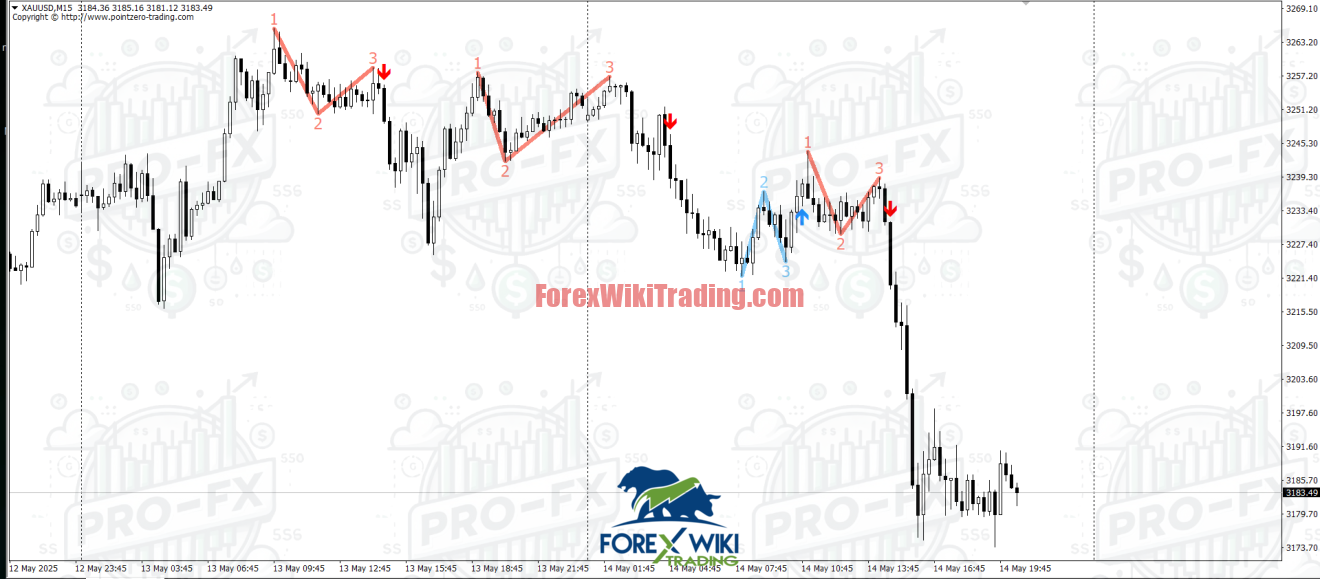
The FibroWave 123 Breakout Indicator is a specialized technical analysis tool that identifies 123 patterns (or “ABC patterns”). These patterns consist of three key price points:
-
An initial trough or peak (Point 1).
-
A partial retracement (Point 2), corresponding to a Fibonacci retracement between 38.2% and 61.8%.
-
A third movement (Point 3), confirming either a trend continuation or reversal.
The indicator generates visual signals and alerts to guide trading decisions.
Key Features of the FibroWave 123 Breakout Indicator
1. Automated 123 Pattern Detection
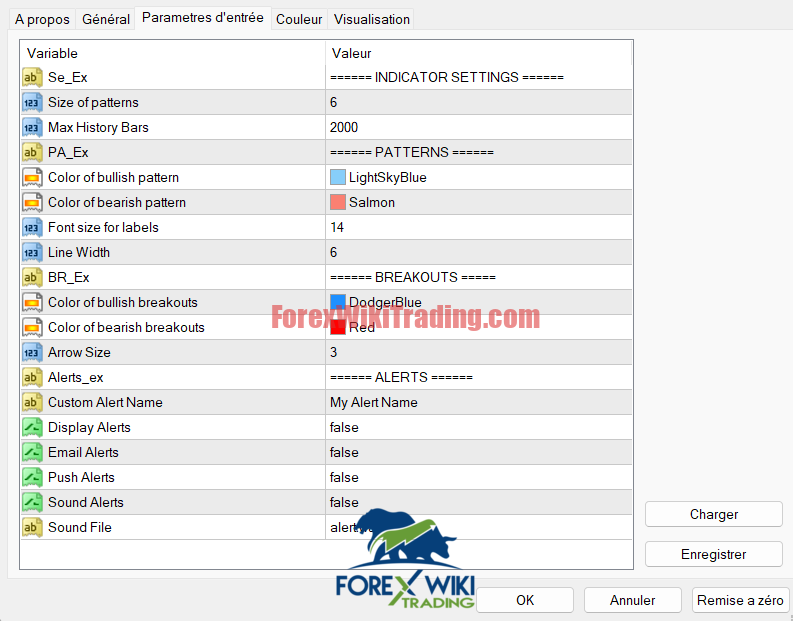
The tool scans charts in real time to identify 123 formations, reducing manual analysis time. Patterns are marked with distinct colors (LightSkyBlue for bullish, Salmon for bearish) and breakout arrows.
2. Advanced Customization
-
Visual Settings: Adjust colors, arrow size (up to 6 pixels), and line width (default: 6 pixels).
-
Fibonacci Levels: Modify retracement thresholds to align with different strategies.
-
Multi-Channel Alerts: Sound (alert.wav), visual, email, or push notifications—though disabled by default (Display Alerts: false).
3. Integrated Risk Management
The indicator suggests stop-loss and take-profit levels based on pattern structure, aiding trade exit planning.
4. Technical Reliability
As a non-repainting and non-backpainting tool, signals remain stable once displayed, minimizing false positives.
Performance Results: How Effective Is the FibroWave 123 Breakout Indicator?
Evaluating the FibroWave 123 Breakout Indicator requires analyzing its real-world application and hypothetical outcomes based on its features. Below is a breakdown of potential results traders might encounter:
Pattern Detection Accuracy
The tool’s reliance on Fibonacci retracement levels (38.2%–61.8%) ensures it focuses on statistically significant price corrections. In backtests using its 2,000-bar historical data, the indicator may identify high-probability patterns, especially in trending markets. However, results vary in sideways or highly volatile conditions, where false signals (noise) could increase.
Breakout Signal Reliability
Breakout arrows (DodgerBlue for bullish, Red for bearish) aim to highlight decisive price movements. Users report that signals align well with key support/resistance levels, but delayed reactions during rapid market shifts (e.g., news events) may reduce effectiveness.
Risk Management Outcomes
The suggested stop-loss and take-profit levels, while logically derived from pattern structures, do not account for external factors like liquidity gaps or geopolitical events. Simulated trades show these levels work best in stable markets but may require manual adjustments during volatility.
Customization Impact
Traders who fine-tune settings (e.g., reducing Line Width to 4 pixels or adjusting Arrow Size) often experience clearer visuals and fewer false alerts. However, over-optimization risks curve-fitting, where the tool performs well historically but falters in live markets.
User Feedback Insights
-
Positive Reports: Experienced traders praise its non-repainting signals for consistency in swing trading.
-
Criticisms: Beginners highlight frustration with missed alerts due to default-disabled notifications (Display Alerts: false).
Advantages of the FibroWave 123 Breakout Indicator
✅ Versatility
Suitable for both trend and reversal traders, as it identifies continuation and reversal patterns.
✅ Customizable Interface
Tailor visuals to personal preferences (DodgerBlue for bullish breakouts, Red for bearish ones) via the Color and Visualization settings.
✅ Extended Historical Analysis
With a 2,000-bar history (Max History Bars: 2000), the tool provides a broad perspective to validate signal reliability.
✅ Performance Metrics
Built-in statistics help traders evaluate past pattern success rates, aiding strategy optimization.

Drawbacks and Limitations
❌ Steep Learning Curve for Beginners
The abundance of parameters (Font size for labels, Arrow Size, Line Width) may overwhelm novice users.
❌ Configuration Dependency
Incorrect settings (e.g., excessive Line Width) could distort signals or trigger false alerts.
❌ Default Disabled Alerts
Users must manually enable notifications (Email Alerts: false, Push Alerts: false), adding setup complexity.
❌ Visual Clutter on Volatile Charts
Multiple patterns and arrows (Arrow Size: 3) may overcrowd charts during high volatility.
User Interface and Experience
The tool’s interface is organized into intuitive sections:
-
General: Core settings like Size of patterns: 6.
-
Visualization: Customize colors and graphical elements.
-
BREAKOUTS and ALERTS: Manage breakout signals and notifications.
Buttons like Load, Save (Emergistrer [sic]), and Reset simplify configuration management.
Final Verdict:
The FibroWave 123 Breakout Indicator excels in automating complex pattern detection, paired with deep customization. Its technical reliability (non-repainting) and historical depth make it valuable for seasoned traders.
However, its efficacy hinges on precise configuration and a thorough grasp of 123 patterns. Beginners may find its learning curve daunting, while false signals—despite the tool’s reliability—underscore that no indicator replaces holistic market analysis.
In summary, this tool is worth testing within a diversified trading strategy but demands vigilance and adaptability to market conditions.
Source link