

Similar Posts
Italian Regulator CONSOB Blocks 6 Financial Websites
The Italian financial services regulator, Consob, revealed Friday that it has cracked down on illegal financial activity by blocking access to a further six websites offering financial services and products without proper authorisation. The latest move brings the total number of blacklisted websites to 1,162 since July 2019. The blacklisted websites include: Tradetospace Global Limited…
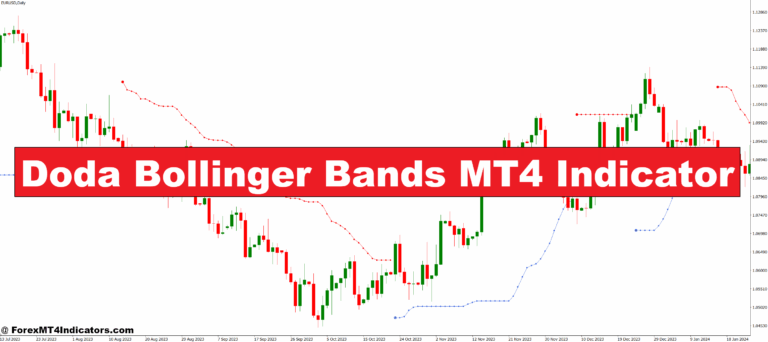
Doda Bollinger Bands MT4 Indicator – ForexMT4Indicators.com
The Doda Bollinger Bands MT4 Indicator is an upgraded version of the traditional Bollinger Bands tool. It uses dynamic upper and lower bands that expand and contract based on market volatility. This makes it perfect for identifying potential reversals or breakout points. Traders can easily visualize when the market is stretched too far in one…
Love and Pain Because Why Not Suffer a Little – Dumb Little Man
Let’s talk about love and pain, shall we? They are the chaotic best friends that always roll in together, whether you invited them or not. Love and pain are like the peanut butter and jelly of human emotion—sweet and sticky, but sometimes you choke a little. And no matter how many times you swear you’re…
Platinum, Palladium, Silver Making Big Turns Versus Gold
Gold seems to be peaking for now 96% bullishness is a warning sign Other commodities ready to move higher CRB Index moving higher again White precious metals heading higher: silver, platinum, palladium Watch nickel very closely. Copper is set to move higher Best plays for PGMs: CHN, ZIM For Silver: LGM For Nickel: CHN, WMG…
Trump Delays Tariffs for 90 Days. The S&P 500 Rebounds Sharply
As shown in the chart of the S&P 500 (US SPX 500 mini on FXOpen), the index is currently trading near the 5,500 level. This result is highly encouraging, considering that as recently as yesterday morning, the index was hovering around 4,900. Why Have Stocks Risen? The strong rebound seen yesterday evening was triggered by…