Analysts betting big on GameStop… But guess who’s back to shake up Wall Street? 🐱
GameStop (GME) stock experienced notable gains on December 16, 2024, driven by a mix of favorable analyst outlooks, upgraded ratings, and renewed social media influence. This upward movement highlights the continued volatility of GameStop shares, which remain highly sensitive to both market sentiment and external factors.
Positive Analyst Outlook Drives Optimism
Wedbush, a leading financial services firm, has recently raised its earnings estimates for GameStop’s fiscal year 2025, signaling renewed confidence in the company’s financial outlook. Notably, Wedbush analyst M. Pachter upgraded GameStop’s earnings per shareEarnings per share (EPS) is a fundamental financial metric that provides valuable insights into a company’s profitability. This widely used indicator helps investors and analysts g… (EPS) forecast for FY2025 from $0.01 to $0.086. The firm also provided optimistic projections for upcoming quarters and fiscal years, reflecting a belief in GameStop’s improving performance.
For investors, such upward revisions are significant. When major firms like Wedbush increase their estimates, it often influences broader market sentiment and attracts investor interest. This bullish outlook underscores the potential for GameStop to stabilize its financial trajectory after years of uncertainty.
Strong Buy Rating Reflects Growing Confidence
Another key factor contributing to GameStop’s stock surge is its recent upgrade to a Zacks Rank #1 (Strong Buy). This ranking is particularly notable because it reflects an upward trend in earnings estimates—a critical driver of stock price momentum.
The Zacks Rank is highly regarded among investors as it identifies stocks with the strongest earnings potential. For GameStop, this upgrade signals that analysts are increasingly optimistic about the company’s ability to deliver better-than-expected financial results. Investors monitoring GameStop’s turnaround efforts are likely to view this as a positive signal for the stock’s future performance.
The Power of Social Media: Roaring Kitty Returns
GameStop’s stock movement remains heavily influenced by social media activity, a trend that originated during the 2021 “meme stockA meme stock is a publicly traded company’s stock that has seen a significant increase in price and trading volume primarily due to hype and popularity driven by social media platf…” frenzy. On December 5, 2024, shares jumped as much as 14% after Keith Gill, widely known by his online alias “Roaring Kitty,” posted on social media for the first time since September. Gill is a central figure in the GameStop saga, having previously galvanized retail investors to rally around the stock.
This recent activity underscores the enduring power of social media influencers to impact GameStop’s stock price. Despite the passage of time, investor enthusiasm tied to figures like Roaring Kitty remains strong, creating sharp moves in the stock whenever such figures reemerge. For investors, this highlights the dual nature of GameStop’s appeal: while the company’s fundamentals are improving, its stock remains heavily susceptible to shifts in sentiment driven by online communities.
GameStop’s Current Stock Performance
As of the latest trading session, GameStop’s stock price reached $29.44, marking a 5.18% increase. This surge came alongside significant trading volume, with over 8.25 million shares traded, compared to the average volume of approximately 10.8 million.
While this performance reflects growing optimism, GameStop’s stock remains highly volatile. The combination of analyst upgrades, social media-driven enthusiasm, and heavy trading activity can lead to rapid price swings, making it an appealing yet risky choice for investors.
GameStop Stock Chart Analysis
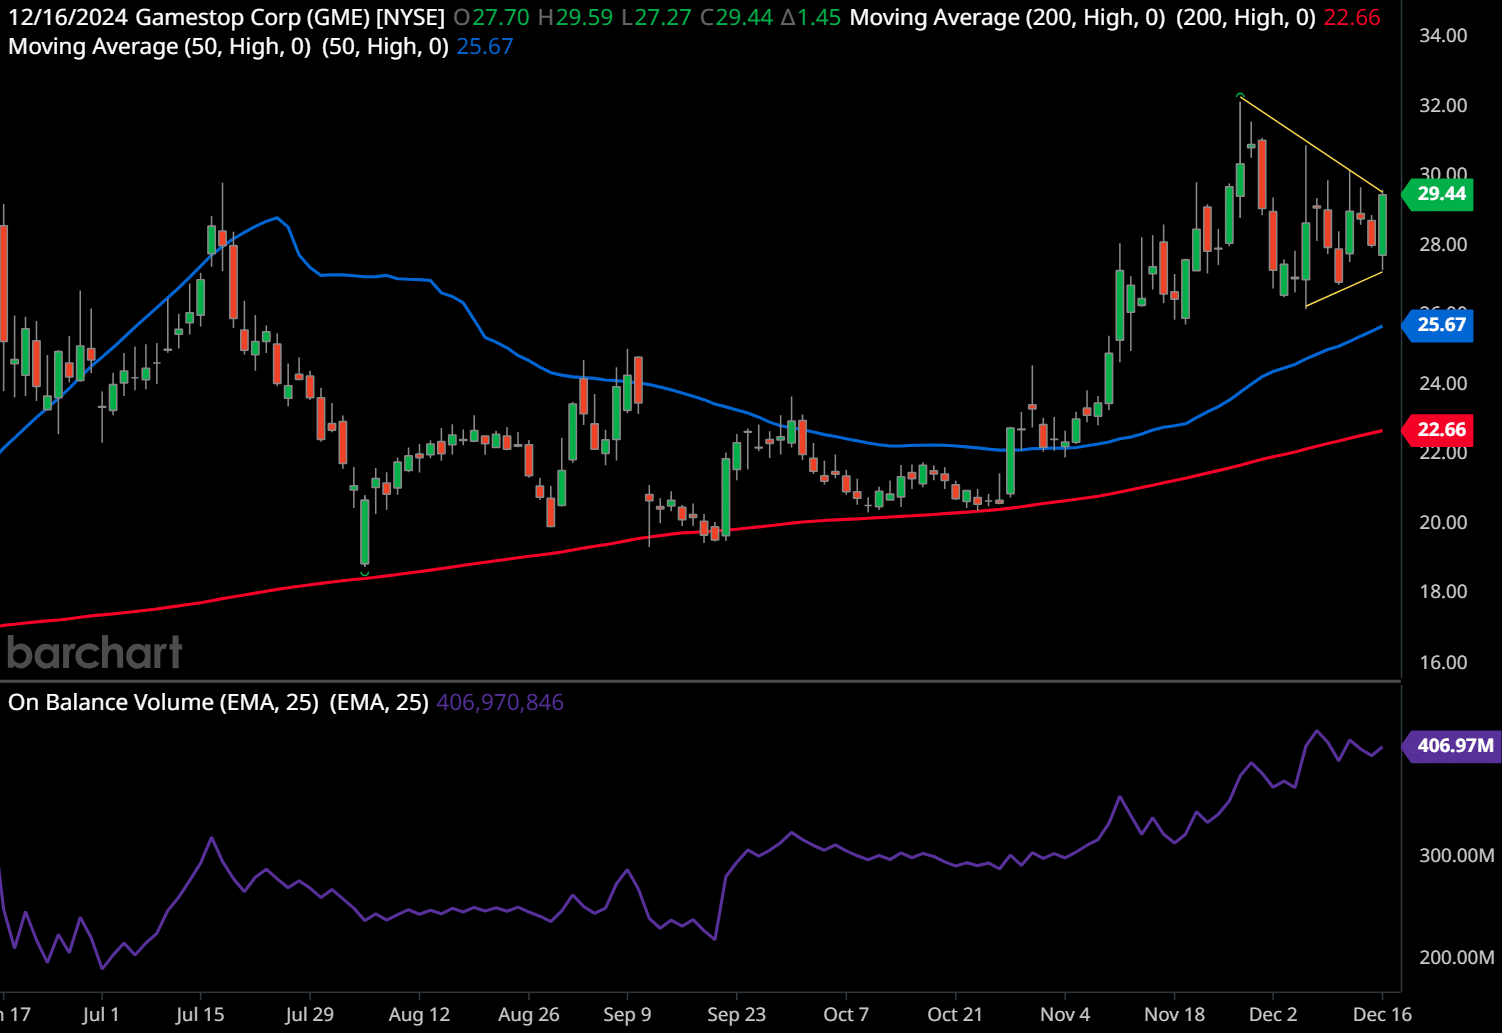
The chart for GameStop Corp (GME) in the daily timeframe displays clear signs of consolidation after a strong upward trend. Below is the comprehensive analysis:
- Support and Resistance Levels:
- Support: The first key support level is near $25.67, which aligns with the 50-day moving averageThe concept of moving averages dates back to the early 20th century. While it is challenging to attribute the invention of moving averages to a single individual, W. P. Hamilton, a… (blue line). The next major support is at the 200-day moving averageThe concept of moving averages dates back to the early 20th century. While it is challenging to attribute the invention of moving averages to a single individual, W. P. Hamilton, a… around $22.66.
- Resistance: Short-term resistance is at $30, a psychological level. The next critical resistance is around $32, the recent swing high.
- Chart Patterns:
A bullish pennant formation is visible. This pattern occurs after a sharp upward price movement followed by consolidation within converging trendlines. A breakoutBreakout patterns occur when a stock price moves beyond a defined level of support or resistance with increased volume, signaling the potential start of a new trend. A breakout ind… above the upper yellow trendline (approximately $30) would confirm the continuation of the bullish trend. - Trend Analysis:
The overall trend is bullish, supported by the upward slope of the 50-day moving averageThe concept of moving averages dates back to the early 20th century. While it is challenging to attribute the invention of moving averages to a single individual, W. P. Hamilton, a… and the price trading well above the 200-day moving averageThe concept of moving averages dates back to the early 20th century. While it is challenging to attribute the invention of moving averages to a single individual, W. P. Hamilton, a…. The rising On-Balance VolumeThe On Balance Volume indicator (OBV) is a technical analysis tool used to measure the flow of money into and out of a security over a specified period of time. It is a cumulative … (OBVThe On Balance Volume indicator (OBV) is a technical analysis tool used to measure the flow of money into and out of a security over a specified period of time. It is a cumulative …) indicator shows increasing buying pressure, confirming that this rally has strong volume support. - Indicators Suggestion:
- The 200-day moving averageThe concept of moving averages dates back to the early 20th century. While it is challenging to attribute the invention of moving averages to a single individual, W. P. Hamilton, a… (red line) acts as a long-term support, suggesting a bullish bias in the long term.
- The 50-day moving averageThe concept of moving averages dates back to the early 20th century. While it is challenging to attribute the invention of moving averages to a single individual, W. P. Hamilton, a… acts as dynamic support, reinforcing short-term bullish momentum.
- OBVThe On Balance Volume indicator (OBV) is a technical analysis tool used to measure the flow of money into and out of a security over a specified period of time. It is a cumulative … indicates accumulation as volume trends upward, reflecting institutional interest or broad market buying.
- Future Trend and Stock Forecast:
- Bull Case: If the price breaks out above the $30-$32 resistance area, the bullish pennant signals a continuation toward $36-$38.
- Bear Case: If the price fails to break out and falls below $25.67 (50-day MA), a move down to $22.66 (200-day MA) could occur.
Overall, the chart favors a bullish continuation as long as the price remains above $25.67.
- Trading Plans:
- Swing Trading Plan:
Entry: Buy at a breakoutBreakout patterns occur when a stock price moves beyond a defined level of support or resistance with increased volume, signaling the potential start of a new trend. A breakout ind… above $30 with strong volume confirmation.
Stop-Loss: Place a stop-loss at $27.50 (below recent lows).
Target: $36-$38 (short-term resistance target).
Risk-Reward Ratio: Approximately 1:3 (depending on entry). - Long-Term Trading Plan:
Entry: Accumulate positions near $25.67 (50-day MA) or on dips to $22.66 (200-day MA).
Stop-Loss: $20 (below key long-term support).
Target: $45-$50 over the next 6-12 months if bullish momentum continues.
Long-term traders can hold positions as long as the 200-day moving averageThe concept of moving averages dates back to the early 20th century. While it is challenging to attribute the invention of moving averages to a single individual, W. P. Hamilton, a… remains intact.
- Swing Trading Plan:
Past performance is not an indication of future results. This analysis should not be considered as investment advice. Always conduct your own research and consider consulting with a financial advisor before making any investment decisions. 🧡
Why GameStop Matters to Investors
GameStop continues to capture investor attention due to its unique position as both a turnaround story and a cultural phenomenon. Analysts’ upgraded earnings estimates and bullish outlooks suggest the company may be on a more stable financial path. Simultaneously, GameStop’s history as a meme stockA meme stock is a publicly traded company’s stock that has seen a significant increase in price and trading volume primarily due to hype and popularity driven by social media platf… ensures that social media remains a critical factor influencing its share price.
For investors, GameStop represents an opportunity to capitalize on its improving financial outlook while navigating its inherent volatility. Its ability to combine fundamentals with market sentiment makes it a stock to watch, particularly for those with a higher risk tolerance.
In conclusion, GameStop’s recent surge highlights the importance of analyst optimism, ratings upgrades, and social media influence. While its volatility poses risks, GameStop remains a compelling case study for investors looking to balance potential gains with the challenges of market unpredictability.
Do you have a news tip for GuerillaStockTrading? Please email us at
[email protected]
💥 GET OUR LATEST CONTENT IN YOUR RSS FEED READER
We are entirely supported by readers like you. Thank you.🧡
At GuerillaStockTrading, we maintain full transparency and impartiality; we never blog about stocks or crypto in which we hold a personal position unless explicitly stated in the article. Additionally, we do not accept paid promotions presented as content. All information shared is for informational purposes only and should not be construed as financial, investment, tax, or legal advice, nor as a recommendation to buy any security or financial asset. The content is general in nature and does not account for individual circumstances. It may not be suitable for your particular situation. Before making financial decisions, you are encouraged to seek guidance from your own financial or investment advisor.