Why Hedera’s Price Surge Has Investors Buzzing: The Game-Changing Upgrade You Need to Know About

HederaHedera Hashgraph, often referred to as Hedera, is a public distributed ledger technology (DLT) that uses a novel consensus mechanism called hashgraph. Unlike traditional blockchain… (HBARHedera Hashgraph, often referred to as Hedera, is a public distributed ledger technology (DLT) that uses a novel consensus mechanism called hashgraph. Unlike traditional blockchain…) has captured investor attention with a notable price surge over the past few days. This upward momentumMomentum in stock trading refers to the rate of acceleration of a stock’s price or trading volume. It indicates the strength of a trend and measures how quickly prices are rising o… is attributed to several developments, each highlighting the growing potential of the HederaHedera Hashgraph, often referred to as Hedera, is a public distributed ledger technology (DLT) that uses a novel consensus mechanism called hashgraph. Unlike traditional blockchain… network and its native token, HBARHedera Hashgraph, often referred to as Hedera, is a public distributed ledger technology (DLT) that uses a novel consensus mechanism called hashgraph. Unlike traditional blockchain…. Below, we explore the key drivers behind the price increase and why HederaHedera Hashgraph, often referred to as Hedera, is a public distributed ledger technology (DLT) that uses a novel consensus mechanism called hashgraph. Unlike traditional blockchain… is gaining importance in the blockchain ecosystem.
Mainnet Upgrade: A Major Milestone
HederaHedera Hashgraph, often referred to as Hedera, is a public distributed ledger technology (DLT) that uses a novel consensus mechanism called hashgraph. Unlike traditional blockchain… is preparing for a significant mainnet upgrade to version 0.57, scheduled for Wednesday at 18:00 UTC. This upgrade has fueled investor optimism and increased trading activity. Mainnet upgrades are pivotal for blockchain projects as they enhance network performance, security, and scalability. The anticipation surrounding this upgrade underscores Hedera’s commitment to innovation, which investors recognize as a key factor in the token’s growth.
Hedera’s focus on providing enterprise-grade blockchain solutions positions it as a leader in the decentralized technology space. Its upgrades ensure the network remains competitive and capable of supporting its growing ecosystem.
Surge in Trading Volume: A Bullish Signal
HBARHedera Hashgraph, often referred to as Hedera, is a public distributed ledger technology (DLT) that uses a novel consensus mechanism called hashgraph. Unlike traditional blockchain… has witnessed a significant rise in trading volume, with spot inflow reaching a 27-day high of over $8 million. Such increased activity often reflects heightened interest and confidence from both retail and institutional investors. This surge in volume indicates a strong demand for the token, further boosting its price.
Trading volume is a crucial indicator of market sentiment. High trading activity for HBARHedera Hashgraph, often referred to as Hedera, is a public distributed ledger technology (DLT) that uses a novel consensus mechanism called hashgraph. Unlike traditional blockchain… demonstrates growing adoption and interest in Hedera’s ecosystem, making it a project worth monitoring for its long-term potential.
Technical Indicators: Positive MomentumMomentum in stock trading refers to the rate of acceleration of a stock’s price or trading volume. It indicates the strength of a trend and measures how quickly prices are rising o…
The Elder-Ray Index, a momentum-based indicator, has turned positive for the first time in a week. This shift suggests stronger buying pressure compared to selling pressure, often a precursor to sustained price gains. Additionally, HBAR’s symmetrical triangleThe symmetrical triangle pattern is one of the most popular chart patterns in the world of technical analysis. This pattern is a result of the convergence of two lines that form a … pattern on the daily chart—a component of a bullish pennantA pennant pattern is a continuation chart pattern that forms after a strong price movement, typically characterized by a brief period of consolidation before the price resumes its … pattern—signals the possibility of a strong breakoutBreakout patterns occur when a stock price moves beyond a defined level of support or resistance with increased volume, signaling the potential start of a new trend. A breakout ind….
For investors, technical analysis provides insights into market trendsUnderstanding market trends is a critical component for businesses conducting industry analysis. For example, Netflix identified early on the growing demand for streaming services … and potential price movements. Hedera’s bullish patterns highlight its current strength and the likelihood of continued upward momentumMomentum in stock trading refers to the rate of acceleration of a stock’s price or trading volume. It indicates the strength of a trend and measures how quickly prices are rising o…, making it an attractive option for traders and long-term holders alike.
Market Positioning: Consolidation at Key Levels
HBARHedera Hashgraph, often referred to as Hedera, is a public distributed ledger technology (DLT) that uses a novel consensus mechanism called hashgraph. Unlike traditional blockchain… is trading above its 50-day Exponential Moving AverageThe concept of moving averages dates back to the early 20th century. While it is challenging to attribute the invention of moving averages to a single individual, W. P. Hamilton, a… (EMA) and has reached the ultimate resistance level of the Murrey Math Lines. These achievements indicate a consolidation phase that could precede further gains. Such positioning reflects Hedera’s ability to maintain stability even during periods of market volatility.
Breaking key resistance levels and maintaining above-average performance are indicators of a strong asset. Hedera’s ability to consolidate at higher levels reinforces its status as a resilient and promising project.
Hedera Crypto Trading Plan
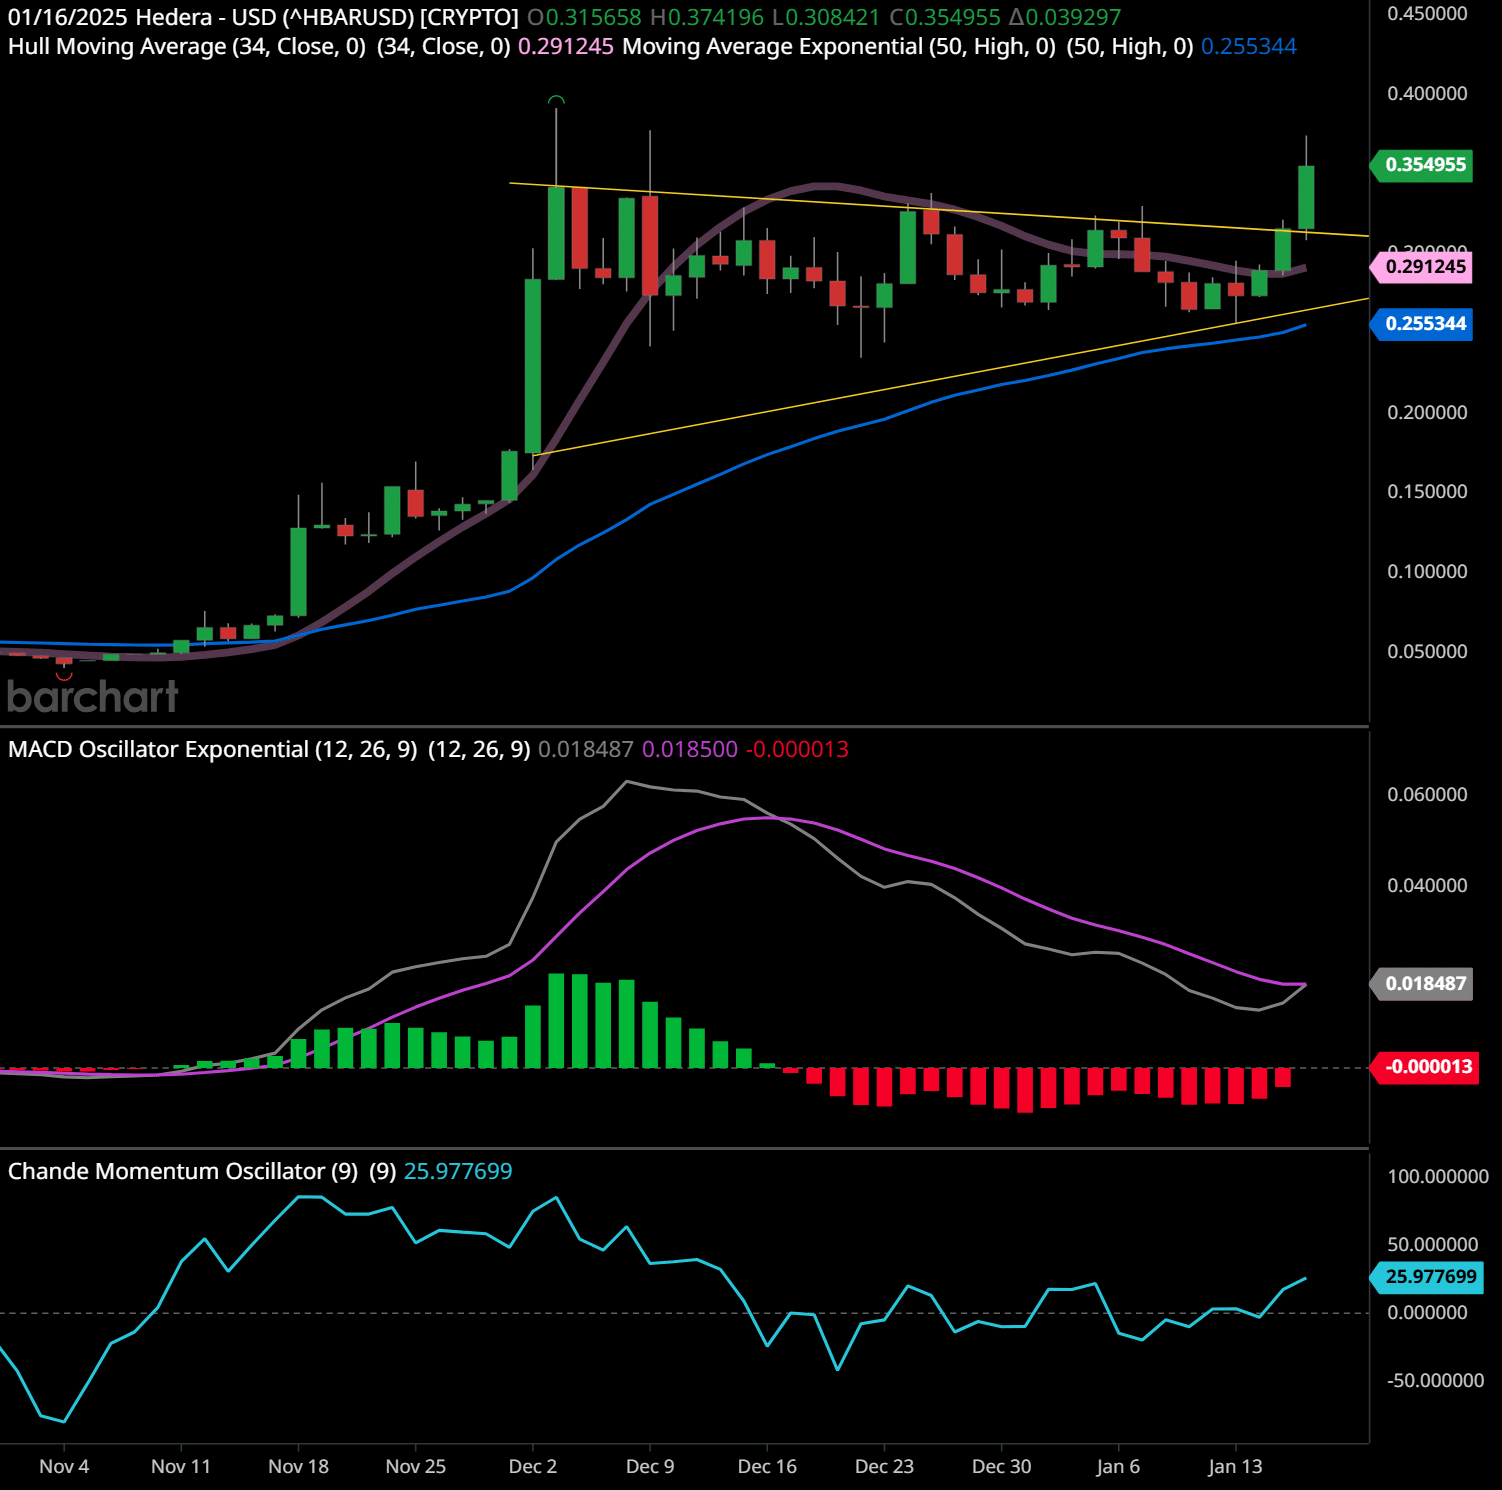
This chart for HederaHedera Hashgraph, often referred to as Hedera, is a public distributed ledger technology (DLT) that uses a novel consensus mechanism called hashgraph. Unlike traditional blockchain… (HBARHedera Hashgraph, often referred to as Hedera, is a public distributed ledger technology (DLT) that uses a novel consensus mechanism called hashgraph. Unlike traditional blockchain…/USD) on the daily timeframe provides important insights into current price action, technical indicators, and potential future trends. Below is a detailed analysis:
The chart shows a symmetrical triangleThe symmetrical triangle pattern is one of the most popular chart patterns in the world of technical analysis. This pattern is a result of the convergence of two lines that form a … breakoutBreakout patterns occur when a stock price moves beyond a defined level of support or resistance with increased volume, signaling the potential start of a new trend. A breakout ind…, as the price has decisively moved above the triangle’s upper resistance line. This breakoutBreakout patterns occur when a stock price moves beyond a defined level of support or resistance with increased volume, signaling the potential start of a new trend. A breakout ind… is accompanied by bullish momentumMomentum in stock trading refers to the rate of acceleration of a stock’s price or trading volume. It indicates the strength of a trend and measures how quickly prices are rising o…, suggesting a potential trend continuation to the upside.
Support and Resistance Levels:
- Support levels:
- $0.291 (Hull Moving AverageThe Hull Moving Average (HMA) is a technical analysis indicator developed by Alan Hull, a finance and investment analyst, to reduce the lag associated with traditional moving avera…, 34-period) – This has acted as a dynamic support zone during consolidation.
- $0.255 (Exponential Moving AverageThe concept of moving averages dates back to the early 20th century. While it is challenging to attribute the invention of moving averages to a single individual, W. P. Hamilton, a…, 50 High) – A significant technical floor.
- Resistance levels:
- $0.355 – The current breakoutBreakout patterns occur when a stock price moves beyond a defined level of support or resistance with increased volume, signaling the potential start of a new trend. A breakout ind… level and potential short-term resistance.
- $0.40 – Psychological and historical resistance zone from earlier highs.
Chart PatternsChart patterns are visual formations on price charts that occur due to the behavior of buyers and sellers in the market. These patterns often signal potential future price movement… and Psychology:
The symmetrical triangleThe symmetrical triangle pattern is one of the most popular chart patterns in the world of technical analysis. This pattern is a result of the convergence of two lines that form a … pattern represents a period of consolidation and market indecision, as buyers and sellers tested each other’s strength. The breakoutBreakout patterns occur when a stock price moves beyond a defined level of support or resistance with increased volume, signaling the potential start of a new trend. A breakout ind… indicates that bulls have regained control, suggesting rising confidence and a shift to optimism. The extended consolidation before the breakoutBreakout patterns occur when a stock price moves beyond a defined level of support or resistance with increased volume, signaling the potential start of a new trend. A breakout ind… implies a possible sustained rally, as pent-up demand is released.
Trend Analysis:
The overall trend remains bullish. The higher lows during consolidation and the breakoutBreakout patterns occur when a stock price moves beyond a defined level of support or resistance with increased volume, signaling the potential start of a new trend. A breakout ind… above the triangle validate upward momentumMomentum in stock trading refers to the rate of acceleration of a stock’s price or trading volume. It indicates the strength of a trend and measures how quickly prices are rising o…. The price has reclaimed both moving averagesThe concept of moving averages dates back to the early 20th century. While it is challenging to attribute the invention of moving averages to a single individual, W. P. Hamilton, a…, which often acts as a confirmation of trend reversal or continuation.
Indicator Analysis:
- MACDThe MACD indicator is essentially a momentum indicator that shows the relationship between two different moving averages of price. The MACD is the difference between the 12-period … Oscillator:
- While still near zero, the MACDThe MACD indicator is essentially a momentum indicator that shows the relationship between two different moving averages of price. The MACD is the difference between the 12-period … histogram is flattening, suggesting bullish momentumMomentum in stock trading refers to the rate of acceleration of a stock’s price or trading volume. It indicates the strength of a trend and measures how quickly prices are rising o… is building. The signal line crossover is not yet definitive, but the MACDThe MACD indicator is essentially a momentum indicator that shows the relationship between two different moving averages of price. The MACD is the difference between the 12-period … is trendingUnderstanding market trends is a critical component for businesses conducting industry analysis. For example, Netflix identified early on the growing demand for streaming services … upward, favoring a bullish case.
- Chande Momentum OscillatorThe Chande Momentum Oscillator (CMO) is a technical indicator that measures momentum in a financial instrument. Developed by calculating the difference between the sum of recent ga… (CMOThe Chande Momentum Oscillator (CMO) is a technical indicator that measures momentum in a financial instrument. Developed by calculating the difference between the sum of recent ga…):
- At 25.97, the CMOThe Chande Momentum Oscillator (CMO) is a technical indicator that measures momentum in a financial instrument. Developed by calculating the difference between the sum of recent ga… shows strong bullish momentumMomentum in stock trading refers to the rate of acceleration of a stock’s price or trading volume. It indicates the strength of a trend and measures how quickly prices are rising o…, though it is not yet overbought. This indicates room for further upside while maintaining healthy price action.
Trader PsychologyTrader psychology refers to the emotions and mental states that influence a trader’s decision-making process in financial markets. Emotions such as fear, greed, hope, and regret …:
Traders are likely shifting from caution to optimism, as the breakoutBreakout patterns occur when a stock price moves beyond a defined level of support or resistance with increased volume, signaling the potential start of a new trend. A breakout ind… has been confirmed. The breakoutBreakout patterns occur when a stock price moves beyond a defined level of support or resistance with increased volume, signaling the potential start of a new trend. A breakout ind… represents a renewed wave of buying pressure after a period of accumulation. Short-term traders may look for quick gains, while long-term investors might see this as an entry opportunity for sustained growth.
Crypto Price Forecast:
In the short-term, further upside toward $0.40 and possibly $0.45 appears likely if bullish momentumMomentum in stock trading refers to the rate of acceleration of a stock’s price or trading volume. It indicates the strength of a trend and measures how quickly prices are rising o… continues. However, a retest of the $0.291-$0.300 support zone could occur before the next leg higher. In the long-term, if the breakoutBreakout patterns occur when a stock price moves beyond a defined level of support or resistance with increased volume, signaling the potential start of a new trend. A breakout ind… holds, this could be the start of a larger uptrend, with targets around $0.50 or higher depending on volume and market sentiment.
Trading Plans:
Swing TradingSwing trading is a popular trading strategy aimed at capturing short- to medium-term gains by taking advantage of price swings in financial markets. Unlike day trading, which invol… Plan:
- Entry: Buy on retest of $0.300-$0.310 (confirmed support after breakoutBreakout patterns occur when a stock price moves beyond a defined level of support or resistance with increased volume, signaling the potential start of a new trend. A breakout ind…).
- Stop-loss: Place a stop-loss below $0.290 to limit downside riskIn stock trading, risk refers to the possibility of losing some or all of the capital invested in a trade. It represents the uncertainty about the future performance of a stock and….
- Target: Take profit around $0.40 (initial target) and $0.45 if momentumMomentum in stock trading refers to the rate of acceleration of a stock’s price or trading volume. It indicates the strength of a trend and measures how quickly prices are rising o… persists.
Long-Term Trading Plan:
- Entry: Accumulate between $0.300 and $0.350 during pullbacks.
- Stop-loss: Place a stop-loss below $0.250 to protect capital.
- Target: Hold for a potential move to $0.50 and beyond if the bullish trend sustains.
Past performance is not an indication of future results. This article should not be considered as investment advice. Always conduct your own research and consider consulting with a financial advisor before making any investment decisions. 🧡
Institutional Interest and Rumors of ETF Approval
Institutional interest in HederaHedera Hashgraph, often referred to as Hedera, is a public distributed ledger technology (DLT) that uses a novel consensus mechanism called hashgraph. Unlike traditional blockchain… has been growing, with speculation about potential ETF approvals and strategic partnerships further driving positive sentiment. Institutional backing often brings credibility and increased capital inflows, which can significantly impact a token’s price and adoption.
Institutional investment often serves as a validation of a project’s value proposition. For HederaHedera Hashgraph, often referred to as Hedera, is a public distributed ledger technology (DLT) that uses a novel consensus mechanism called hashgraph. Unlike traditional blockchain…, this growing interest could mean sustained growth and greater adoption across industries.
Ecosystem Growth: Expanding Total Value Locked
The HederaHedera Hashgraph, often referred to as Hedera, is a public distributed ledger technology (DLT) that uses a novel consensus mechanism called hashgraph. Unlike traditional blockchain… ecosystem continues to grow, with nearly $180 million in total value locked (TVL) across its network. This increasing TVL reflects rising user activity and trust in the platform’s decentralized applications (dAppsdApps, short for decentralized applications, are a type of software program that runs on a blockchain or a peer-to-peer network of computers rather than a single centralized server…) and services.
The expansion of Hedera’s ecosystem strengthens its utility and attractiveness as a blockchain platform. A growing TVL is a key metric of user engagement and network health, which are essential for long-term success.
Looking Ahead: Hedera’s Promising Future
The combination of technological advancements, bullish technical indicators, and growing ecosystem activity has driven a significant price increase for HBARHedera Hashgraph, often referred to as Hedera, is a public distributed ledger technology (DLT) that uses a novel consensus mechanism called hashgraph. Unlike traditional blockchain…, with the token surging over 10% in the last 24 hours. Investors looking for blockchain projects with strong fundamentals and growing adoption should closely monitor HederaHedera Hashgraph, often referred to as Hedera, is a public distributed ledger technology (DLT) that uses a novel consensus mechanism called hashgraph. Unlike traditional blockchain….
Hedera’s unique approach to blockchain technology, coupled with its enterprise focus and ecosystem growth, positions it as a leader in the decentralized technology space. Its potential for further adoption and innovation makes it an attractive option for both short-term trading opportunities and long-term investments.
Lance Jepsen is the senior personal finance writer for Guerilla Stock Trading who has spent more than 25 years covering the stock market and economics. In addition, Lance has worked as a private stock analyst for a number of high worth individuals.
Top Performing Cryptos (24 hours)
Do you have a news tip for GuerillaStockTrading? Please email us at [email protected]
🗨️ JOIN OUR COMMUNITY OF STOCK TRADERS AND INVESTORS ON SOCIAL MEDIA
💥 GET OUR LATEST CONTENT IN YOUR RSS FEED READER
We are entirely supported by readers like you. Thank you.🧡
At GuerillaStockTrading, we maintain full transparency and impartiality; we never blog about stocks or crypto in which we hold a personal position unless explicitly stated in the article. Additionally, we do not accept paid promotions presented as content. All information shared is for informational purposes only and should not be construed as financial, investment, tax, or legal advice, nor as a recommendation to buy any security or financial asset. The content is general in nature and does not account for individual circumstances. It may not be suitable for your particular situation. Before making financial decisions, you are encouraged to seek guidance from your own financial or investment advisor.
Trading and Investment Ideas:
Source link