Housing May 27th Weekly Update: Inventory up 2.9% Week-over-week, Up 37.0% Year-over-year
by Calculated Risk on 5/27/2024 09:21:00 AM
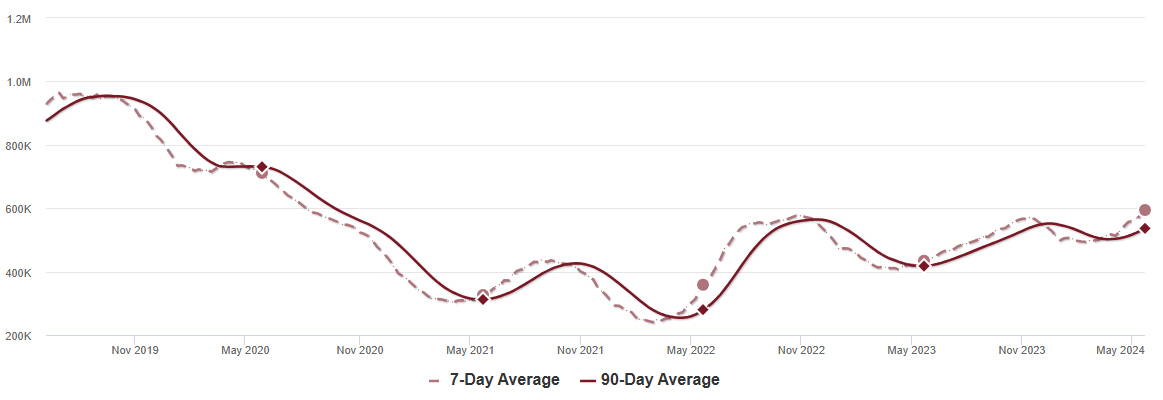
Altos reports that active single-family inventory was up 2.9% week-over-week. Inventory is now up 20.3% from the February bottom, and at the highest level since August 2020.
 Click on graph for larger image.
This inventory graph is courtesy of Altos Research.
As of May 24th, inventory was at 595 thousand (7-day average), compared to 578 thousand the prior week.
Inventory is still far below pre-pandemic levels.
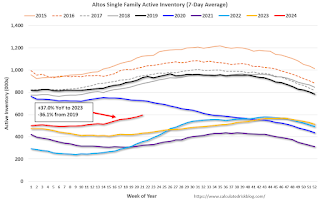
The second graph shows the seasonal pattern for active single-family inventory since 2015.
The red line is for 2024. The black line is for 2019. Note that inventory is up 84% from the record low for the same week in 2021, but still well below normal levels.
Inventory was up 37.0% compared to the same week in 2023 (last week it was up 36.0%), and down 36.1% compared to the same week in 2019 (last week it was down 36.4%).
Back in June 2023, inventory was down almost 54% compared to 2019, so the gap to more normal inventory levels is slowly closing.
Source link