Intel’s Stock Soars Amid Acquisition Speculation and Analyst Optimism

Intel’s stock experienced a dramatic surge on February 18, 2025, climbing 16.06% to close at $27.39. The sharp increase was fueled by acquisition speculation involving Broadcom and Taiwan Semiconductor Manufacturing Company (TSMC), along with an analyst upgrade that signaled renewed confidence in the company’s future. The market’s reaction highlights growing optimismOptimism is a Layer 2 scaling solution for Ethereum that leverages optimistic rollups to enhance transaction throughput and reduce gas fees while maintaining Ethereum’s security…. that Intel’s restructuring efforts could position it more competitively in the semiconductor industry.
Reports indicate that Broadcom and TSMC are actively exploring bids to divide Intel’s operations, with each company eyeing specific segments of the business. Broadcom has expressed interest in acquiring Intel’s chip design division, which could align with its broader ambitions in AI and networking. Meanwhile, TSMC is reportedly considering a takeover of Intel’s manufacturing segment, though adapting Intel’s existing foundry infrastructure to TSMC’s processes presents notable challenges.
While no deal has been officially confirmed, the mere possibility of such a restructuring has significantly boosted investor sentiment. In premarket trading, Intel’s stock soared by 9–10%, with exceptionally high activity throughout the trading session. It emerged as the most traded stock in the S&P 500, underscoring the market’s renewed focus on Intel’s transformation.
For investors, Intel’s potential breakup could unlock value by allowing its design and manufacturing segments to operate independently under more specialized leadership. The move could also enable the company to better compete with rivals like TSMC and Nvidia, both of which have dominated key segments of the semiconductor industry in recent years.
Analyst Upgrade and Market Reaction
The rally in Intel’s stock was further fueled by an analyst upgrade from Cantor Fitzgerald, which raised the company’s price target from $22 to $29. The firm cited improved sentiment around Intel’s strategic repositioning and the potential for a more focused business structure. The upgrade also came alongside a surge in trading volume, with 113 million shares exchanging hands—representing a 28% increase from previous averages.
For investors, this analyst endorsement suggests that Wall Street sees potential in Intel’s ability to regain competitiveness. After years of lagging behind TSMC in manufacturing efficiency and losing ground to Nvidia in AI chips, Intel appears to be taking steps to close the gap. The company’s turnaround efforts, particularly in AI and foundry services, are critical to its long-term success.
Intel’s Struggles and Path Forward
Despite the recent rally, Intel’s stock remains well below its previous highs. Throughout 2024, the company faced significant challenges, including a nearly 60% stock decline due to manufacturing delays and leadership turmoil. Intel’s attempts to reposition itself as a leading AI chipmaker and foundry services provider have faced stiff competition from more established players.
However, the potential acquisition discussions suggest a shift in strategy that could help Intel regain its footing. If Broadcom were to take over Intel’s chip design unit, it could provide the resources needed to accelerate development in AI and high-performance computing. Meanwhile, a TSMC-led acquisition of Intel’s manufacturing division could improve efficiency and bolster Intel’s foundry ambitions, though regulatory and geopolitical hurdles may complicate such a deal.
Intel Trading Plan
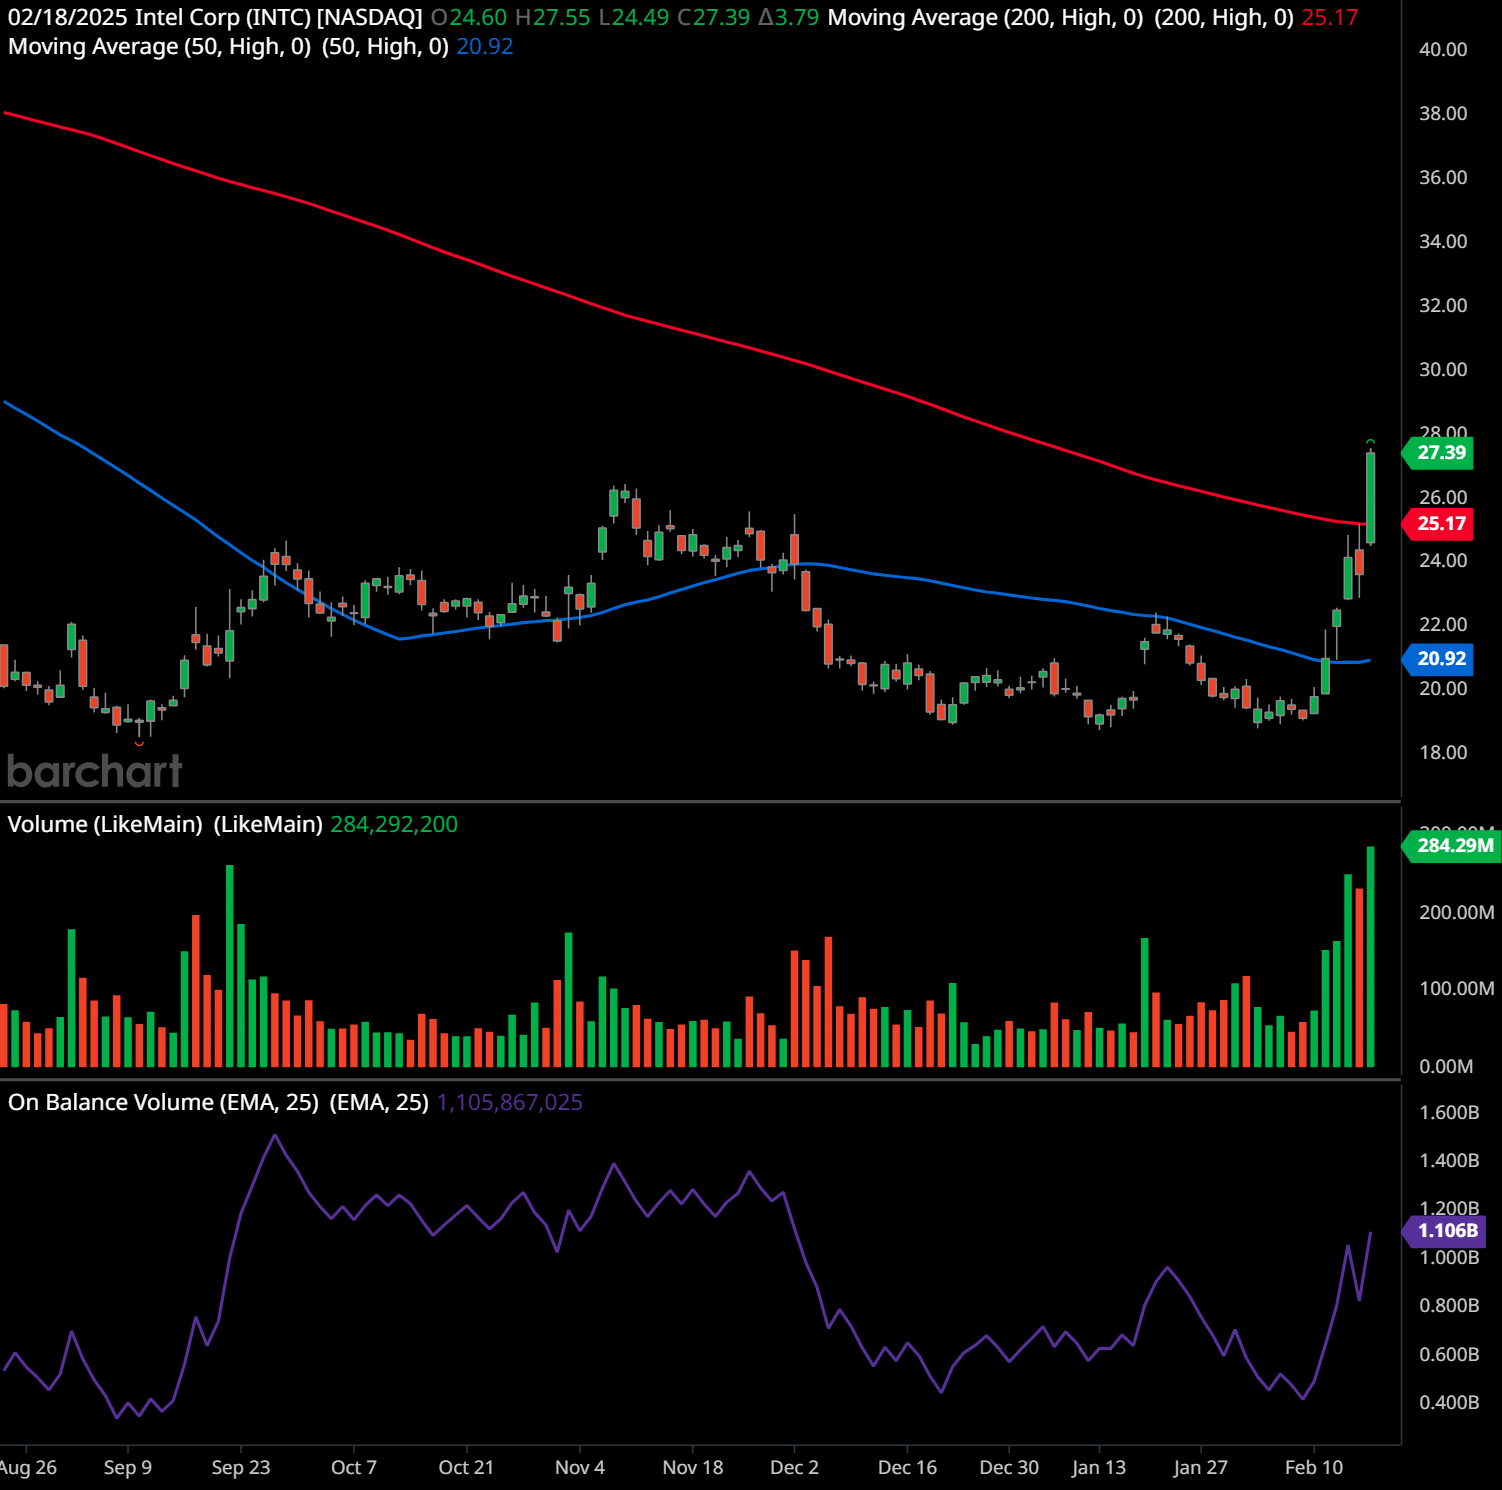
Intel Corp (INTC) has experienced a significant price breakoutBreakout patterns occur when a stock price moves beyond a defined level of support or resistance with increased volume, signaling the potential start of a new trend. A breakout ind…, closing at $27.39 after a strong rally. The price surged $3.79 (+16.06%) on high volume, indicating strong buying interest. The stock moved past the 50-day moving averageThe concept of moving averages dates back to the early 20th century. While it is challenging to attribute the invention of moving averages to a single individual, W. P. Hamilton, a… (20.92) and is now testing resistance at the 200-day moving averageThe concept of moving averages dates back to the early 20th century. While it is challenging to attribute the invention of moving averages to a single individual, W. P. Hamilton, a… (25.17), which it has broken above.
Support and resistance levels:
- Key support is now at the previous resistance level of $25.17 (200-day moving averageThe concept of moving averages dates back to the early 20th century. While it is challenging to attribute the invention of moving averages to a single individual, W. P. Hamilton, a…). If the stock pulls back, $24 and $22 will be additional support zones.
- Resistance is seen near $28, where the stock stalled in November. If broken, the next target is $30.
Future trends and technical analysis:
- The high volume spike (284.29M shares) suggests institutional accumulation, reinforcing bullish momentumMomentum in stock trading refers to the rate of acceleration of a stock’s price or trading volume. It indicates the strength of a trend and measures how quickly prices are rising o….
- The On-Balance VolumeThe On Balance Volume indicator (OBV) is a technical analysis tool used to measure the flow of money into and out of a security over a specified period of time. It is a cumulative … (OBVThe On Balance Volume indicator (OBV) is a technical analysis tool used to measure the flow of money into and out of a security over a specified period of time. It is a cumulative …) is sharply rising, confirming strong demand behind the price action.
- The stock has moved from a recent bottom (~$18) in late January and is now forming a potential trend reversal.
- The stock is now in a short-term uptrend but needs to hold above the 200-day moving averageThe concept of moving averages dates back to the early 20th century. While it is challenging to attribute the invention of moving averages to a single individual, W. P. Hamilton, a… to confirm a sustained bullish trend.
Chart patternChart patterns are visual formations on price charts that occur due to the behavior of buyers and sellers in the market. These patterns often signal potential future price movement… and trader psychologyTrader psychology refers to the emotions and mental states that influence a trader’s decision-making process in financial markets. Emotions such as fear, greed, hope, and regret …:
- A potential double-bottom pattern is forming, with the second bottom near $18 and a breakoutBreakout patterns occur when a stock price moves beyond a defined level of support or resistance with increased volume, signaling the potential start of a new trend. A breakout ind… above the $25 resistance zone. This pattern typically signals a trend reversal.
- The sharp move higher suggests a shift in sentiment from bearish to bullish, likely driven by earnings or positive news.
- Traders who were short may have been forced to cover, adding to the upward momentumMomentum in stock trading refers to the rate of acceleration of a stock’s price or trading volume. It indicates the strength of a trend and measures how quickly prices are rising o…. New buyers are entering, seeing this as a breakoutBreakout patterns occur when a stock price moves beyond a defined level of support or resistance with increased volume, signaling the potential start of a new trend. A breakout ind… opportunity.
Stock price forecast:
- Short-term (next few weeks): If the stock holds above $25.17, it could test $28–$30. A pullback to the breakoutBreakout patterns occur when a stock price moves beyond a defined level of support or resistance with increased volume, signaling the potential start of a new trend. A breakout ind… zone (~$25) would be healthy before resuming higher.
- Medium-term (next few months): If the stock stays above the 200-day moving averageThe concept of moving averages dates back to the early 20th century. While it is challenging to attribute the invention of moving averages to a single individual, W. P. Hamilton, a…, it may establish an uptrend toward $32–$35.
- Long-term (6–12 months): If Intel executes well fundamentally, this could be the start of a larger recovery trend, with potential upside toward $40.
Trading plans:
Swing TradingSwing trading is a popular trading strategy aimed at capturing short- to medium-term gains by taking advantage of price swings in financial markets. Unlike day trading, which invol… Plan:
- Entry: Around $26–$27 on a slight pullback.
- Stop-loss: Below $24.50 (below the breakoutBreakout patterns occur when a stock price moves beyond a defined level of support or resistance with increased volume, signaling the potential start of a new trend. A breakout ind… level).
- Profit target: $30–$32 (next resistance level).
- Risk-to-reward: Favorable if stop-loss is managed properly.
Long-Term Trading Plan:
- Entry: Accumulate around $25–$27 if the stock holds above the 200-day moving averageThe concept of moving averages dates back to the early 20th century. While it is challenging to attribute the invention of moving averages to a single individual, W. P. Hamilton, a….
- Stop-loss: Below $22 if the breakoutBreakout patterns occur when a stock price moves beyond a defined level of support or resistance with increased volume, signaling the potential start of a new trend. A breakout ind… fails.
- Profit target: $35–$40 over the next year, assuming positive fundamentals.
- Consider scaling in to reduce riskIn stock and crypto trading, risk refers to the possibility of losing some or all of the capital invested in a trade. It represents the uncertainty about the future performance of ….
Past performance is not an indication of future results. This article should not be considered investment advice. Always conduct your own research and consider consulting with a financial advisor before making any investment decisions. 🧡
Investor Implications and Industry Outlook
The surge in Intel’s stock reflects broader market expectations that the company is undergoing a critical transition. While the possibility of an acquisition is speculative, the restructuring concept has resonated with investors looking for signs that Intel can regain relevance in the semiconductor industry.
For investors, Intel remains a high-risk, high-reward opportunity. Its legacy as a semiconductor giant is being challenged by more agile competitors, but its brand, intellectual property, and government-backed foundry initiatives provide strong potential catalystsIn stock trading, a catalyst refers to an event, news, or announcement that causes a significant and often rapid price movement in a stock or the broader market. Catalysts can be p…. Whether through acquisitions, internal restructuring, or improved execution, Intel’s next moves will be closely watched by market participants seeking to understand the future of semiconductor competition.
Lance Jepsen is the senior personal finance writer for Guerilla Stock Trading who has spent more than 25 years covering the stock market and economics. In addition, Lance has worked as a private stock analyst for a number of high worth individuals.
Trading and Investment Ideas:
Source link