Test: Can AI Read Investor Earnings Calls Better Than Humans
My research started as “how to decipher earnings calls”, but during my benchmark testing of TrendSpider, I realized there is a whole new AI-powered way to decipher the underlying sentiment and context.
In the blink of an eye, you might just have an edge with TrendSpider Sidekick. Stay tuned for a revelation.
This article will show you how to decipher earnings calls manually and the new way with AI.
Earnings call transcripts can feel overwhelmingly dense, but honestly, they’re packed with some of the sharpest insights you’ll find for stock research. You can learn to manually scan transcripts, pull out key signals from management’s tone and guidance, and actually use that info to sharpen your investment moves.
You’ll notice that the structure of an earnings call points you straight to the right sections—management commentary, Q&A, and those forward-looking bits. With tools like Seeking Alpha or Stock Rover, you can jump into transcripts, look back at past calls, and catch shifts in performance or sentiment that sometimes don’t show up in the numbers.
With a few practical habits, you’ll read transcripts faster, spot real trends, and plug them straight into your stock analysis. The point? Make informed decisions and skip the noise.
Key Takeaways
- Learn to extract useful insights from earnings call transcripts fast
- Use reliable tools to find, compare, and break down company calls
- Apply focused reading habits to boost your stock research accuracy
The Better Way: Using TrendSpider SideKick AI for Earnings Calls
Earnings call transcripts are one of the richest sources of insight available to investors. They contain management’s explanations of results, forward-looking guidance, analyst questions, and subtle shifts in tone that can reveal more than the financial statements alone. The challenge is time. A single transcript can run 20–40 pages. During peak earnings season, that becomes overwhelming.
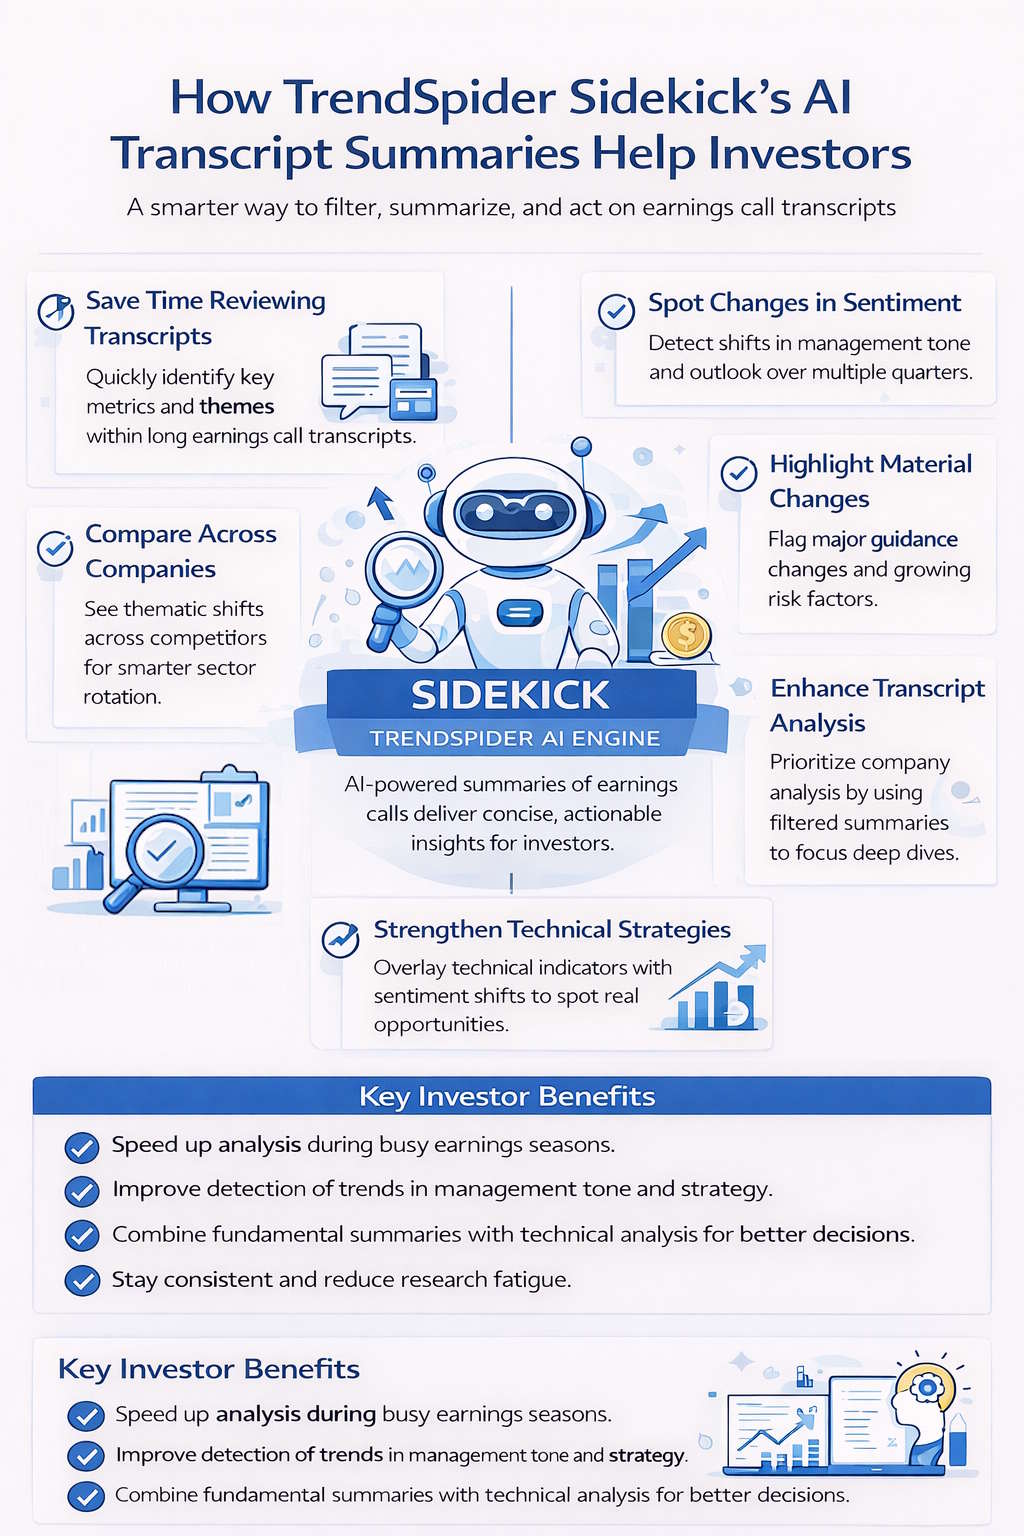
This is where Sidekick, the AI engine built into TrendSpider, becomes highly valuable. By summarizing earnings call transcripts and extracting key themes, Sidekick enables investors to focus on the signal rather than the noise. Used correctly, it can dramatically improve efficiency, consistency, and depth of analysis.
Below is a structured overview of why AI-powered transcript summaries are helpful—and how investors can integrate them into a disciplined research process.
Real-World Test: Is AI Better Than Me Deciphering Earnings Calls?
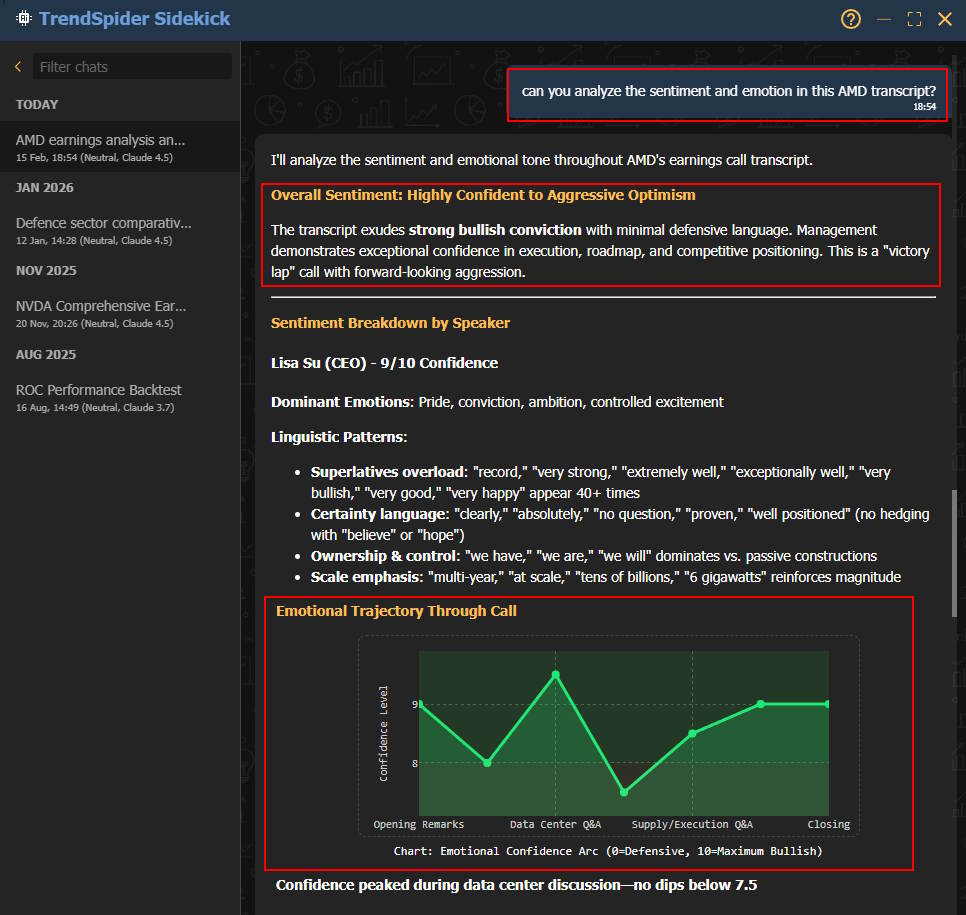
I attended the recent AMD earnings call and thought I had a good grasp of the outcome. But I thought I would test my interpretation of it with the only tool I know that has a top AI rating AAA 4.72 TrendSpider. See for yourself my interactions.
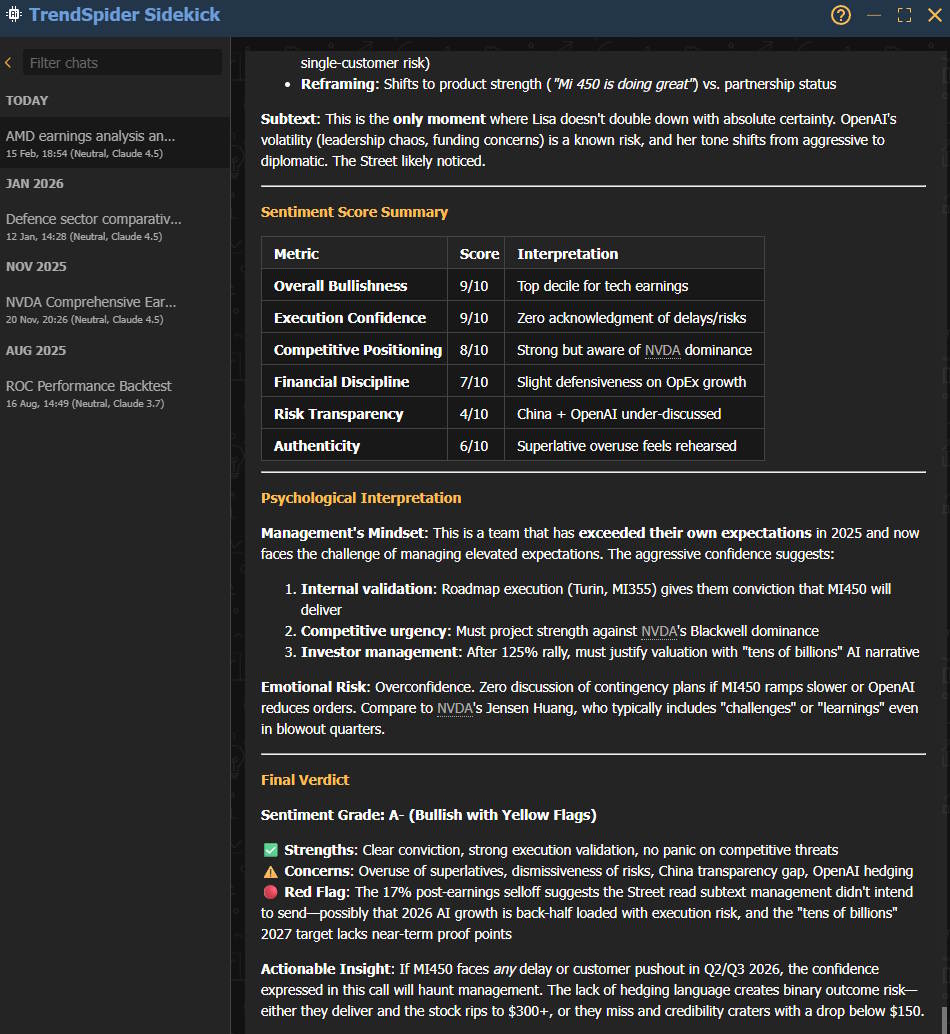
TrendSpider is our top-rated AI trading and automation tool, and I asked its Sidekick to analyze the sentiment of the call. Tip: Look at the red highlights.
Not only did it provide the emotional trajectory of the call, but it also rated the call on Bullishness, confidence, discipline, transparency, and authenticity. (See below)
Yes, I think it did a better job than I did.
How Sidekick Actually Helps Me During Earnings Season
I used to spend 30 to 60 minutes reading a single earnings transcript. By the time I finished five, my focus was gone. Prepared remarks, Q&A, guidance tweaks, tone shifts — it’s all valuable, but it’s dense.
Now I use Sidekick to compress that first pass into minutes.
It highlights revenue changes, margin trends, guidance updates, and recurring themes such as “macro headwinds” or “AI investment.” It highlights what analysts kept pressing on in the Q&A. It summarizes management’s outlook, so I immediately know whether the story improved or deteriorated.
I don’t skip the full transcript entirely. But I only deep-dive when the summary tells me it’s worth it. During earnings season, that leverage is huge. Instead of fully reading five transcripts, I can screen twenty and focus my time where it matters.
It Helps Me Spot What Actually Changed
Markets react more to narrative shifts than to raw numbers.
What I really want to know is:
- Did management get more cautious?
- Did guidance tighten?
- Are margins under pressure?
- Is demand softening?
Sidekick isolates that delta — what’s different this quarter versus last quarter.
When you read long transcripts quickly, it’s easy to miss subtle language changes. AI catches recurring phrases, tone shifts, and framing differences. That helps me identify trend changes earlier instead of reacting late.
For me, that’s one of the biggest advantages.
It Structures the Numbers So I Don’t Miss the Balance
Earnings calls mix hard data and soft language. I care about:
- Revenue growth
- EPS
- Free cash flow
- Margins
- Retention metrics
- Forward guidance
Sidekick organizes all of that into a clean summary. Instead of hunting for numbers buried in paragraphs, I get a structured recap.
That helps me avoid two mistakes:
- Getting swayed by a confident tone but ignoring weak numbers
- Obsessing over numbers while ignoring deteriorating language
Seeing both together keeps my analysis balanced.
The Q&A Becomes Much More Useful
The Q&A is where the real story often lives. Analysts push on weak spots — rising costs, slowing demand, and margin compression.
Sidekick flags:
- Repeated concerns
- Defensive answers
- Vague responses
- Emerging risks
If three analysts keep pressing on inventory or bookings, that’s not noise — that’s friction.
Without AI, I might miss those repetition patterns. With it, I immediately see the pressure points.
It Tracks Tone Across Quarters
Tone matters more than most investors admit.
When “temporary headwinds” become “prolonged macro challenges,” that’s a shift.
When “confident outlook” turns into “cautious optimism,” that’s a signal.
Sidekick helps me track sentiment changes across multiple quarters. Over time, that becomes an early warning system.
When I combine that with the price charts in TrendSpider, it becomes even more powerful. If tone weakens but price continues to rise, I pay attention. If tone improves before a breakout, that’s interesting too.
Narrative plus price action — that’s where insight happens.
It Makes Sector Comparisons Faster
I rarely look at one company in isolation. I want context.
Instead of manually reading five semiconductor transcripts, I can review five Sidekick summaries and quickly see:
- Who’s raising guidance
- Who’s cutting CapEx
- Who sounds confident
- Who sounds cautious
That speeds up sector rotation decisions and portfolio weighting adjustments. It gives me breadth without sacrificing depth.
It Integrates Naturally With Technical Analysis
What I like most is that Sidekick doesn’t sit in isolation.
I can:
- Review the transcript summary
- Overlay earnings on the chart
- Study breakouts or failed moves
- Compare tone with momentum
If management raises guidance but the stock can’t break resistance, that divergence matters.
If the tone weakens but price trends higher, that may signal complacency.
Sidekick strengthens the fundamental side of the equation. TrendSpider handles the technical side. Together, I get a more complete picture.
It Reduces Research Fatigue
Reading transcripts back-to-back quickly drains mental energy.
Fatigue leads to:
- Missed details
- Confirmation bias
- Overconfidence
- Anchoring to management’s narrative
AI summaries cut through the noise. I get the key metrics, risks, tone shifts, and guidance changes without wading through fluff.
That preserves my mental bandwidth for:
- Position sizing
- Risk management
- Portfolio allocation
- Scenario modeling
Efficiency compounds. When I conserve energy, my decisions improve.
It’s Not a Replacement — It’s a Multiplier
I don’t treat Sidekick as a substitute for thinking. I treat it as a filter.
My process looks like this:
- Review Sidekick summary
- Decide if the company warrants deeper analysis
- Read key transcript sections if needed
- Cross-check with filings and financials
- Align with valuation and technical structure
AI accelerates the first step. It doesn’t replace judgment — it enhances it.
And during earnings season, that acceleration becomes a real edge.
Instead of drowning in transcripts, I stay selective, structured, and focused on what actually moves stocks.
Why Earnings Call Transcripts Matter
Earnings call transcripts provide a clear record of what company leaders say about financial results and their outlook. They let you judge management credibility, see what’s really driving performance, and maybe even catch early signs of a shift in the company’s competitive standing.
Key Insights for Investors
Earnings call transcripts capture the actual words of executives during calls with analysts and shareholders. You will hear how the CEO and CFO break down revenue trends, margins, and expectations for the next. Their tone, confidence, or even awkward pauses can sometimes say more than the numbers.
Watch for patterns in language and data. If management keeps repeating “cost discipline” or “macro uncertainty,” that’s usually a signal of margin pressure or potential slowdowns. When you compare what they say across quarters, you can assess whether their story aligns with the results.
Analysts use transcripts to tweak forecasts and adjust price targets. You can do the same by focusing on quantitative details—sales growth, capex, and cash flow. Tools like Stock Rover make it easy to cross-check transcript takeaways with financial ratios and valuation metrics in your own portfolio.
Find and Access Earnings Call Transcripts Manually
You can find earnings call transcripts on company investor relations pages, financial media sites, and specialized third-party databases. Each source varies in coverage, speed, and ease of search, so your choice depends on how quickly you need the information and how deep you want to go.
Company Investor Relations Websites
Most public companies post earnings call transcripts, audio, and slides on their Investor Relations (IR) pages. Usually, you’ll spot them under “Events & Presentations” or “Financial Reports.” Companies listed on the NSE or BSE typically put up transcripts within 24–48 hours after the call.
IR sites give you the most official and accurate transcripts. You’ll also find regulatory filings like 10‑Qs or annual reports, which help you double-check management’s claims. Navigation can be hit or miss—some sites only keep the last few quarters, while others offer multi‑year archives.
When you want raw, unfiltered info, start at the company’s own site. Bookmark the IR page for each stock you follow to save yourself a scramble every earnings season.
Financial Content Platforms
Sites like Seeking Alpha, The Motley Fool, and MarketBeat round up transcripts from thousands of companies. These services make it way easier to search and scan for keywords across multiple firms, saving you from bouncing between IR sites.
Seeking Alpha, for instance, uploads transcripts within hours and usually tags speakers and timestamps. You can filter by ticker, sector, or date. The Motley Fool leans into summarized commentary and key quotes, not full scripts.
If you use Stock Rover, you can blend transcript data with financial numbers to see if management’s story matches the fundamentals. That combo helps you connect the narrative with hard numbers during post‑earnings reviews.
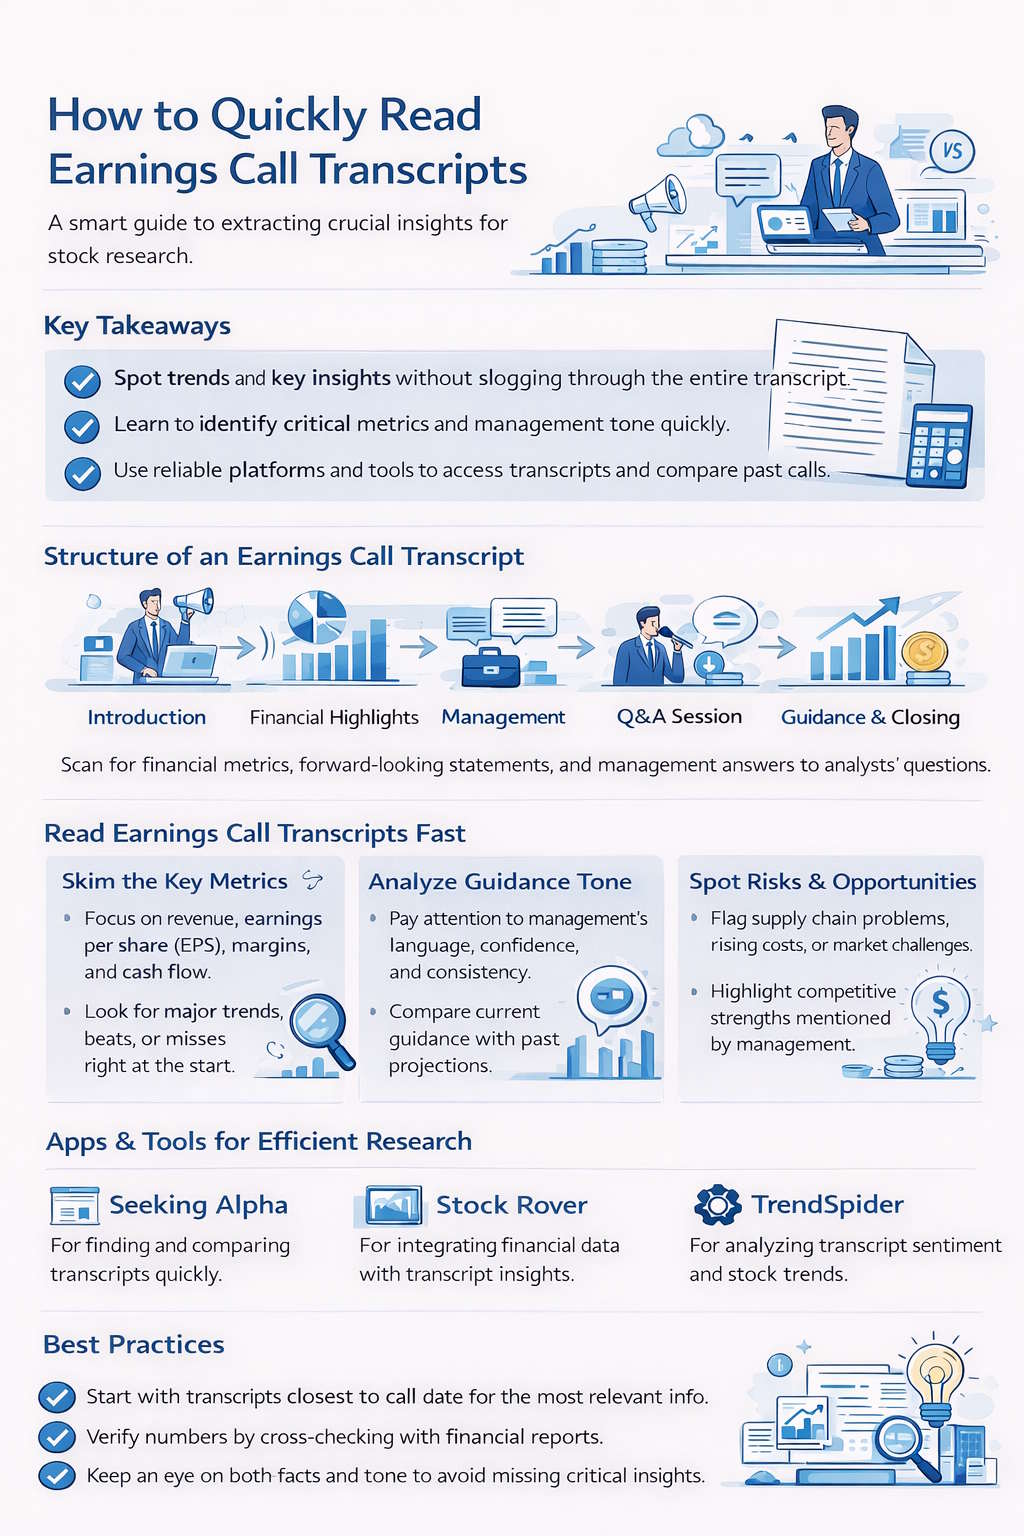
Structure of an Earnings Call Transcript
Earnings call transcripts typically follow a familiar structure, making it easier to focus on the key points. They kick off with prepared remarks from management, move into analyst Q&A, and wrap up with forward-looking statements about what’s next.
Prepared Remarks and Opening Statements
The prepared remarks section starts the call and sets the overall mood. The CEO usually opens with a summary of performance, market conditions, and major events. The CFO then presents financial details—such as revenue growth, margins, costs, and cash flow.
This part is scripted and pretty factual. Executives highlight business model tweaks, product launches, or cost moves that shaped the quarter. You can scan for percent changes in the main metrics or stack them up against previous quarters to spot trends.
Check for tables or bullets that break down segment performance. These show which divisions are driving growth or slowing it. If you’re using a platform like Stock Rover, you can see how these numbers compare to sector peers.
Management Q&A with Analysts
Once the scripted portion ends, the management Q&A section begins. Analysts ask about profitability, capital allocation, and strategy. The CEO and CFO answer on the fly, which is where you can spot real confidence—or nerves.
Zero in on follow-up questions because they often reveal weak spots. If several analysts press on supply chain issues, you know it’s a pain point.
Jot down recurring themes. A simple two-column table (Question | Management Response) can help you track if answers match up with public filings. Tools like Seeking Alpha let you search transcripts by topic or executive, speeding up the process.
Guidance and Forward-Looking Statements
The last section covers guidance—what management expects for revenue, earnings, or margins next quarter or year. The CFO usually lays out these projections, explaining assumptions about demand, pricing, or costs.
Focus on quantitative targets and qualifiers, such as “assuming stable input prices.” These little disclaimers show how confident—or cautious—management feels.
Compare their guidance with previous calls or analyst consensus. If they tighten their range or lower forecasts, see whether they attribute it to external factors or internal issues.
You can chart these projections in TradingView to compare the outlook with the market or sector.
Techniques to Read Transcripts Fast and Effectively
You can get through earnings call transcripts faster by zeroing in on the facts that actually move the market—financial results, management’s tone, and operational details. Use structured reading habits and digital tools to pull out what matters without losing the bigger picture.
Spotting Guidance and Sentiment
Management’s forward-looking guidance usually moves the stock price more than the just-reported numbers. Watch for words like “expect,” “forecast,” or “target.” Compare this guidance with prior quarters to assess whether the outlook is tightening or loosening.
Pay close attention to tone and sentiment. If you hear “strong demand” or “temporary headwinds,” those are clues about confidence. Automated sentiment analysis tools can help you measure tone quickly, especially during earnings season when you’re wading through tons of calls.
If English isn’t your first language, use translation tools or transcripts with clean formatting to cut down on confusion. Keep a cheat sheet of trigger words or phrases that hint at optimism or caution.
Identifying Red Flags and Follow-Ups
Red flags usually pop up in the Q&A section. Analysts examine issues such as rising costs, missed revenue targets, or weak operational efficiency. If management starts dodging questions or giving fuzzy answers, that’s a sign something’s off.
Make a follow-up list for deeper digging. Say management mentions “temporary supply issues”—pull up later filings or earnings reports and see if those problems stick around.
Use formatting to spot risks fast:
- Bold for repeat issues
- Italics for one-time events
- Underline anything you need to double-check
These cues help you connect the dots across different quarterly earnings transcripts.
Integrating Transcripts with SEC Filings
Start by lining up what’s said in the transcript with the 10-K and 10-Q filings. The filings contain the official, audited numbers; the transcript provides the context behind them. When management explains why revenue or margins moved, check whether that aligns with the actual financials.
Try a checklist:
- Confirm management’s story matches the numbers.
- Note any gaps between GAAP and adjusted metrics.
- Track how guidance stacks up versus previous quarters.
Comparing Management Commentary Over Time
One transcript’s just a snapshot. When you read a few, you start to see patterns. Compare what management says each quarter and watch for changes in tone or repeated excuses for missed targets.
Build a table to track consistency:
| Quarter | Revenue Guidance | Key Themes | Confidence Level | Follow-up Action |
|---|---|---|---|---|
| Q1 2024 | Raised | Expansion in Asia | High | Review margins |
| Q2 2024 | Maintained | Cost control | Moderate | Watch expenses |
Seeking Alpha makes it easy to pull up old transcripts and spot long-term narrative changes if you see phrases like “temporary headwinds” over and over, management’s probably trying to manage expectations instead of fixing real problems.
Assessing Business Strategy and Confidence
You can usually tell where the company’s headed by how execs talk about growth, spending, and competition. Look for specifics—not just “we’re investing in innovation,” but how much, when, and what they expect to get back.
Confidence shows up in both delivery and data. If execs keep dodging or get defensive, that’s a red flag. Match what you hear with earnings reports and analyst questions to see if they’re credible.
If you track sentiment, TrendSpider lets you combine transcript keywords with price trends. That way, you can see if the market buys what management’s selling—or not.
Limitations and Best Practices
Earnings call transcripts show you how management presents results, handles tough questions, and frames the future. You get better at stock research when you check for selective disclosure, verify facts from multiple places, and use consistent analytical standards.
Recognizing Bias and Omissions
Execs usually spotlight strengths and gloss over weaknesses. They might highlight revenue growth but omit details on rising costs or debt. Analysts and investment banks sometimes ask questions that align with their clients’ interests, which adds value.
Look for hedging language—“we expect,” “we believe,” or “we remain confident.” That’s usually code for “we’re not sure.” Track how this language changes quarter to quarter to identify shifts in confidence.
Try this checklist:
- Spot repeated talking points.
- Note questions management dodges or redirects.
- Flag statements with no data to back them up.
Source link