Lecture 2: Understanding Market Structure In SMC – The Foundation Of Institutional Trading | Trading Strategy Guides
Introduction
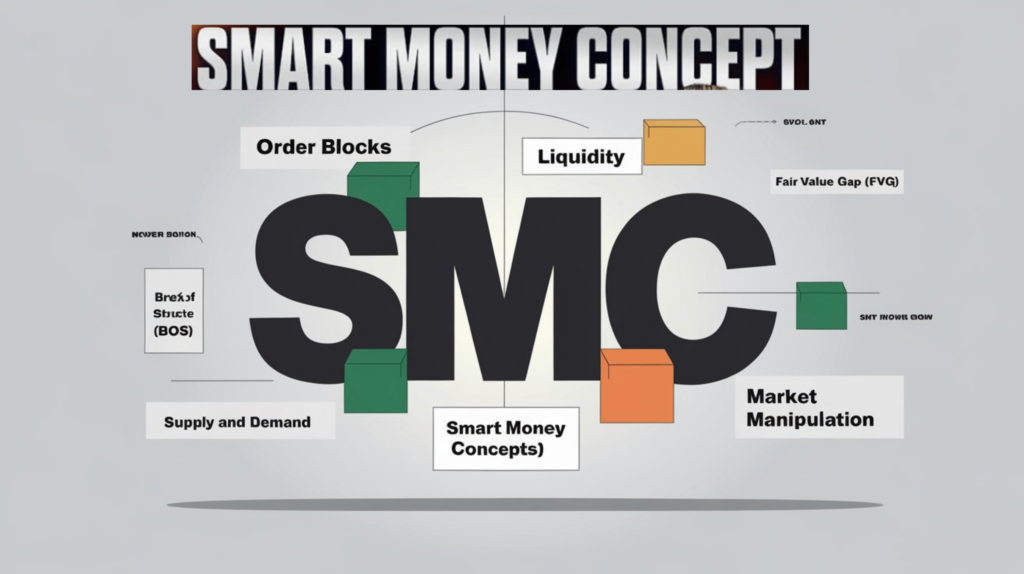
Market structure is the backbone of Smart Money Concept (SMC) trading. Without understanding how price moves in stages, traders cannot identify entry zones, trend shifts, or institutional footprints. In this lesson, we’ll break down market structure into clear stages, show how to track trends, and explain why understanding structure puts you ahead of most retail traders.
What is the Market Structure of SMC?
Market structure refers to the sequence of price swings (higher highs, lower lows, etc.) that form the skeleton of the chart. SMC traders study structure to understand how Smart Money controls price flow. When institutions accumulate (buy) or distribute (sell), price leaves clear clues in its structure — your job is to spot them.
Key Elements of Market Structure
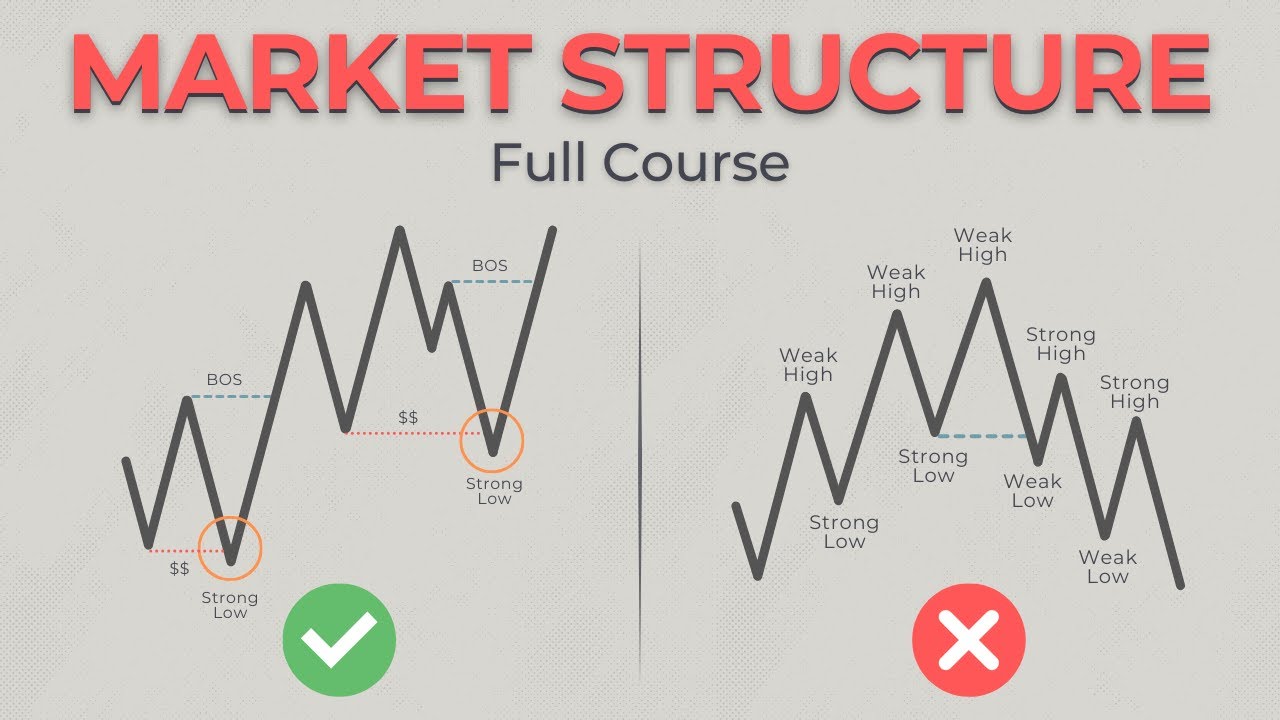
1. Trends and Phases
- Uptrend: Higher Highs (HH) and Higher Lows (HL)
- Downtrend: Lower Lows (LL) and Lower Highs (LH)
- Consolidation: Sideways movement, no clear trend.
2. Break of Structure (BOS)
- A Break of Structure happens when price breaks the previous high or low.
- In an uptrend, a BOS confirms bullish continuation.
- In a downtrend, a BOS confirms bearish continuation.
Example:
Price forms:
HL → HH → BOS (higher high broken) → HL → HH
This confirms the uptrend.
3. Change of Character (CHoCH)
- This marks the first clue that the trend might reverse.
- If the price breaks structure against the current trend, it’s a potential CHoCH.
Example:
In an uptrend:
Higher High → Lower Low (breaking a higher low) = CHoCH (Bearish Shift)
4. Liquidity Zones and Structure
Smart Money builds liquidity above/below clear structure points (like previous highs/lows). These act as magnets for price.
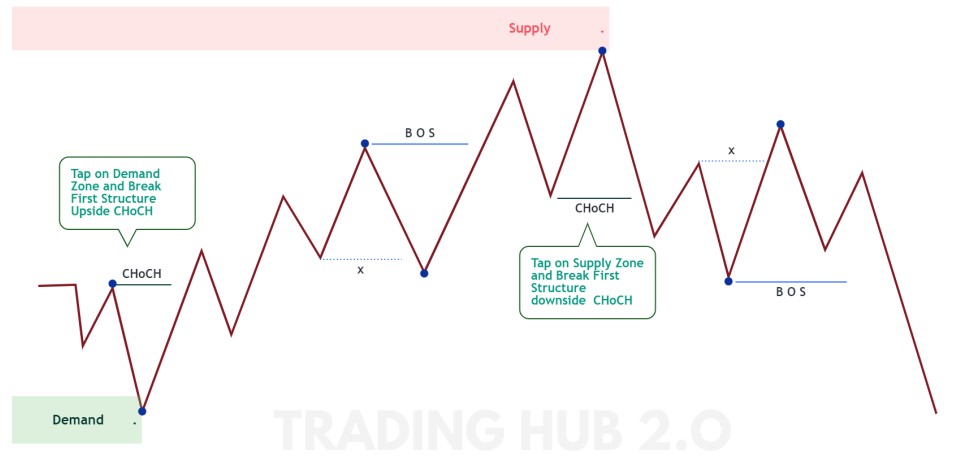
Visual Diagram – SMC Market Structure
Here’s a simplified view of the market structure in SMC:
Uptrend:
HL → HH → HL → HH (with BOS at each HH)
Downtrend:
LH → LL → LH → LL (with BOS at each LL)
Trend Reversal:
Uptrend → CHoCH (break below HL) → Downtrend begins
Let’s convert this into a visual chart for your blog:
Diagram 1: Market Structure Flow in SMC
Comparing Retail and SMC Views on Structure
| Aspect | Retail Traders | SMC Traders |
| Trend Definition | Moving averages | Higher highs/lows, BOS, CHoCH |
| Reversals | Indicator crossovers | Structural breaks (CHoCH) |
| Focus | Indicator-based | Liquidity and Order Flow |
| Targets | Random Take Profits | Liquidity Pools, Order Blocks |
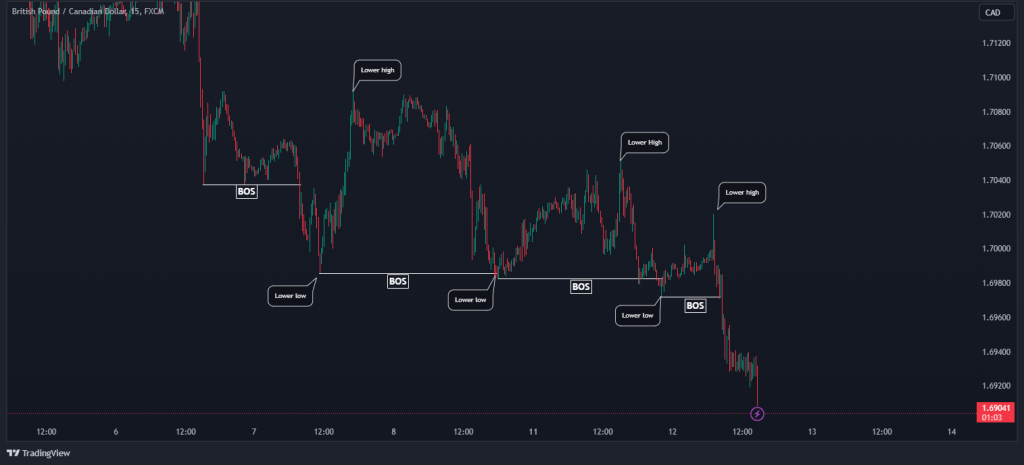
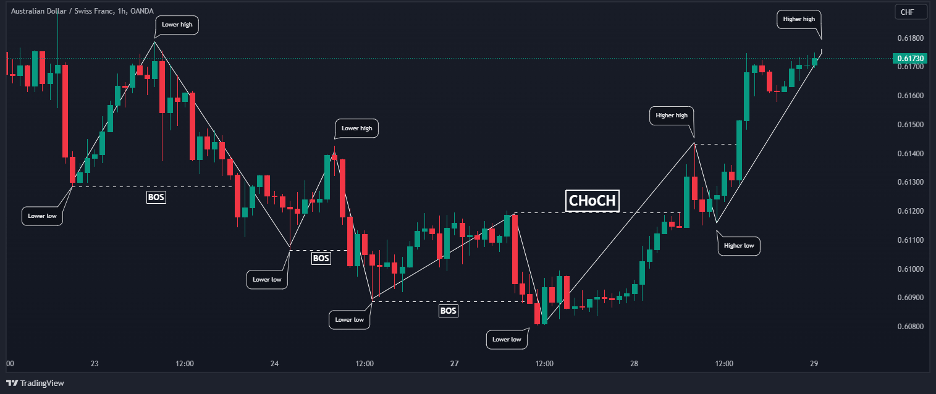
Practical Example – Spotting Structure on a Chart
- Price makes higher highs and higher lows.
- Suddenly breaks below a higher low – this is a CHoCH.
- Price creates a lower high, confirming the new downtrend.
- Smart Money uses this shift to trap late buyers, then sweeps liquidity.
Diagram 2: Real-Chart Example (Structure Change)
Why Structure Matters in SMC
- Timing Entries: You enter after CHoCH into a new trend.
- Avoid Chasing Price: Structure keeps you patient until confirmation.
- Follow Smart Money: They build a structure to disguise their moves.
Conclusion
Without understanding market structure, SMC trading is impossible. Structure tells you where the price is heading, where liquidity sits, and where institutions might step in. In Lesson 3, we’ll build on this by introducing Order Blocks – the institutional footprints you can trade directly.
Source link