Lecture 9: How To Predict Inside Bar Breakout Direction: 5 Proven Technical Analysis Methods | Trading Strategy Guides
Welcome back! Last week, you learned where to take profits. Today, I’m teaching you something that will transform your inside bar trading: how to predict which direction they’ll break before it happens.
Most traders wait for breakouts and react. Smart traders read the clues and position themselves for the likely outcome. This skill turns inside bar trading from guesswork into strategic positioning.
Let me show you exactly how to do it.
The Direction Prediction Game-Changer
Here’s what separates amateur inside bar traders from professionals: amateurs trade breakouts in either direction, professionals bias toward the most probable direction.
While we can’t predict with certainty, we can stack the odds heavily in our favor using context clues that reveal market intentions.
Clue 1: Trend Direction (The Strongest Signal)
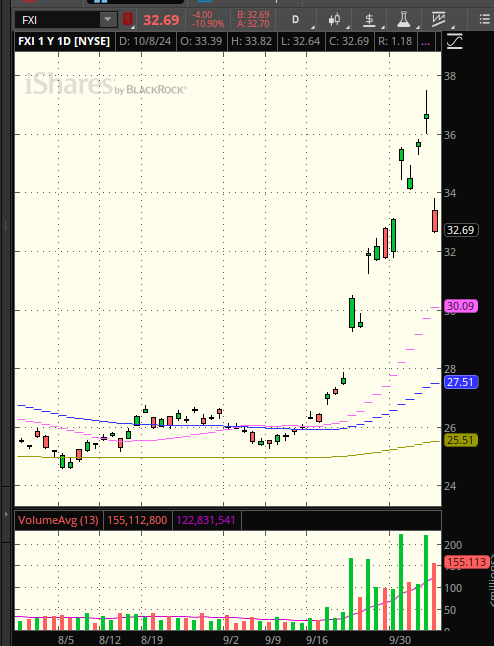
The most powerful predictor is the underlying trend. Inside bars in strong trends typically break in the trend direction 70-80% of the time.
EUR/USD is in a strong uptrend, pulls back, and forms an inside bar at a key support level. Even though the inside bar could break either way, the upward bias is overwhelming.
Why? Because trends represent the path of least resistance. It takes significant force to reverse a strong trend, while continuation requires minimal energy.
The trend bias rule: Never bet against strong trends without exceptional reversal signals. Always favor continuation over reversal.
Clue 2: Market Structure Position
Where the inside bar forms within market structure gives huge direction clues.
Inside bars at support levels after downward moves often break upward as buyers step in. Inside bars at resistance after upward moves frequently break downward as sellers emerge.
Think of it like a basketball bouncing off the floor – it’s much more likely to go up than continue down when it hits a solid surface.
Structure also includes previous swing highs and lows. Inside bars near significant lows tend to bounce, while those near significant highs often fail.
Clue 3: Volume Pattern Analysis
Volume tells you who’s really participating in the move that created your inside bar. High volume on the mother bar suggests institutional involvement and likely continuation.
If EUR/USD drops 200 pips on massive volume, then forms an inside bar, the high-volume selling pressure suggests more downside ahead. Institutions don’t usually reverse course immediately after major moves.
Conversely, if the mother bar had weak volume, the subsequent inside bar is more likely to reverse since the initial move lacked conviction.
Clue 4: Multiple Timeframe Alignment
Check higher timeframes for directional bias. If the daily chart shows a strong uptrend while your 4-hour inside bar could break either way, favor the upward break.
Higher timeframes represent more significant market forces. A weekly uptrend carries more weight than a 1-hour downward move.
The alignment principle works like this: daily trend up + 4-hour inside bar = bias toward upward break. The bigger timeframe wins most directional battles.
Clue 5: News and Market Sentiment
Recent news events often create directional bias that persists through inside bar formations. If major economic data just came out bullish for USD, inside bars in USD pairs will likely break in USD’s favor.
Market sentiment also matters. During risk-on periods, growth currencies and stocks trend higher. During risk-off, safe havens and defensive assets get bid.
The key is understanding the current market narrative and positioning accordingly.
The Confluence Method
The magic happens when multiple clues align. An inside bar at support, in an uptrend, after high-volume selling, with bullish news, and higher timeframe support creates overwhelming upward bias.
Single factors provide hints. Multiple factors converging provide high-confidence direction calls.
Example: GBP/USD forms an inside bar at major support (structure), within a strong uptrend (trend), after a high-volume drop (volume), with positive UK data just released (news). This screams upward break.
False Signal Warning Signs
Sometimes the obvious direction is wrong. Watch for these warning signs:
Multiple failed attempts in the expected direction often precede reversals. If price keeps testing support without breaking, a breakdown becomes more likely.
Divergence between price and momentum indicators can signal direction changes. If price makes lower lows but RSI makes higher lows, expect upward breaks despite downward structure.
Extremely crowded positioning also creates reversal risk. When everyone expects upward breaks, markets often do the opposite.
The 70-30 Rule
Even with perfect analysis, inside bars still break against the expected direction 20-30% of the time. This is normal and expected.
Your goal isn’t perfection – it’s probability. Getting direction right 70% of the time with proper risk management creates excellent long-term returns.
Accept that some high-conviction calls will fail. It’s part of the game.
Practical Direction Analysis
Here’s my step-by-step process for direction bias:
Check the trend on higher timeframes. Identify where the inside bar sits within market structure. Analyze volume on the mother bar. Look for confluence factors. Assign a probability to each direction.
If analysis suggests 70%+ probability for one direction, trade that bias aggressively. If it’s closer to 50-50, use smaller positions or wait for better setups.
Your Direction Prediction Assignment
Find three current inside bar setups. For each one, analyze trend direction, structure position, volume patterns, and timeframe alignment. Predict the most likely breakout direction and assign confidence levels.
Track these predictions over the next week to calibrate your analysis skills.
The Prediction Mindset
Remember, you’re not trying to be a fortune teller. You’re reading probability based on market behavior patterns that repeat consistently.
Sometimes the 30% outcome occurs – that’s trading. Your edge comes from consistently identifying the 70% probability situations and positioning accordingly.
Tomorrow’s Advanced Topic
Tomorrow we’re tackling one of the trickiest aspects of inside bar trading: managing false breakouts. You’ll learn to recognize them early, protect yourself from losses, and even profit from the reversals.
False breakouts are inside bar trading’s biggest challenge, but with the right knowledge, they become manageable and sometimes profitable.
But today, practice reading directional clues. Start seeing inside bars not as neutral patterns, but as setups with probable outcomes based on context.
This skill transforms inside bar trading from reactive to predictive. You’ll position for likely outcomes rather than simply reacting to whatever happens.