Liquidity — The Real Reason Price Moves
Welcome Back — Today Everything Clicks Into Place
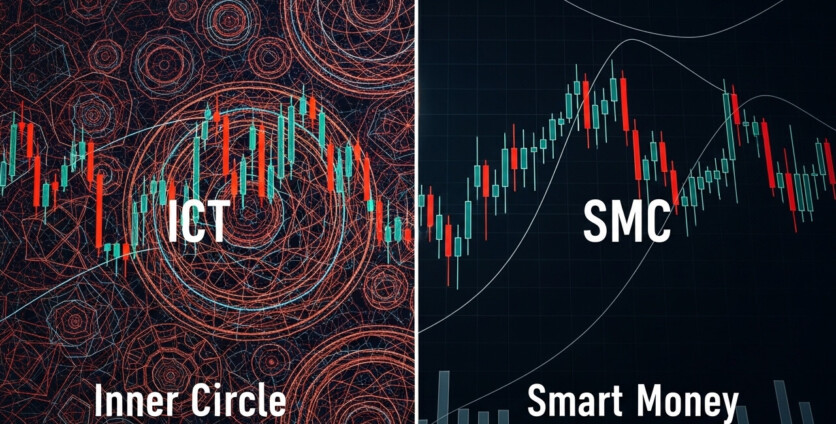
Day 4. If you’ve been following this series from the start, you’ve learned what ICT and SMC are, where they came from, and how to read market structure. Today we go one level deeper — into the concept that explains why price does what it does.
Not patterns. Not indicators. Not support and resistance in the traditional sense.
Liquidity.
This is the engine behind every move you’ve ever seen on a chart. Once you understand it, you’ll stop asking “why did price fake out there?” — because you’ll already know.
What Liquidity Actually Means in This Context
In standard finance, liquidity means how easily an asset can be bought or sold. In ICT and SMC, it means something more specific and far more useful: liquidity is the pool of pending orders — stop losses and buy/sell stops — resting at predictable price levels.
Here’s the crucial insight: large institutions cannot just click a button and enter a $500 million position like you or I can enter a trade. They need opposing orders on the other side to fill against. They need someone to sell to them when they buy, and someone to buy from them when they sell. That supply of opposing orders is liquidity — and retail traders, by placing their stops at predictable levels, create it constantly.
This is why price doesn’t move randomly. It moves purposefully — toward where the orders are.
Buy-Side Liquidity (BSL) and Sell-Side Liquidity (SSL)
These are the two fundamental pools your charts are full of every single day.
Buy-Side Liquidity (BSL) sits above recent highs. When a trader goes short, their stop loss is placed above that high — a buy stop order that triggers automatically if price moves against them. Stack enough of these together and you have a dense pool of buy orders resting above any significant swing high, equal high, or previous session high.
Sell-Side Liquidity (SSL) sits below recent lows. When a trader goes long, their stop loss rests below that low — a sell stop order. Enough of these below any swing low, equal low, or key support level, and you have a pool of sell orders waiting to be triggered.
Institutions target both of these pools. They drive price into these clusters, trigger the stops, absorb the orders created, and then reverse in the direction they always intended to go.
The Stop Hunt — What It Looks Like in Real Time
This is what a stop hunt looks like in practice. Price is ranging. Retail traders see a strong resistance level — an obvious double top or equal high — and go short, placing their stops just above. Price then spikes above that level, triggering every one of those stops. The shorts are forced to close, creating a flood of buy orders. Institutions absorb those buy orders to fill their short positions, and then price drops aggressively.
You weren’t wrong about the direction. You were just positioned on the wrong side of the liquidity pool.

Equal Highs and Equal Lows — The Traps Retail Traders Walk Into
Equal highs and equal lows deserve special attention because they are magnets for institutional activity. When price forms two or more similar highs at the same level, retail traders see strong resistance and pile in short. When it forms two or more similar lows, they see strong support and pile in long.
Institutions see something entirely different — they see a densely packed liquidity pool just waiting to be tapped. Equal highs are almost always swept before a true reversal. Equal lows are almost always swept before a genuine bullish continuation. The retail crowd is simply providing the fuel.
Premium and Discount Zones — Where Should You Be Buying and Selling?
This concept answers one of the most common beginner questions: is this a good price to enter?
Every dealing range — the space between a swing low and a swing high — has a midpoint called equilibrium, found at the 50% level. Everything above that midpoint is the premium zone — price is considered expensive relative to the range. Everything below is the discount zone — price is considered cheap.
The rule in both ICT and SMC is clean and intuitive: buy in discount, sell in premium. Institutions accumulate long positions in discount zones and distribute or sell in premium zones — it’s simply buying cheap and selling expensive at a structural level.
Draw on Liquidity (DOL) — Where Is Price Actually Going?
In ICT specifically, the concept of Draw on Liquidity answers the single most important question before any trade: where is price actually being pulled toward?
The DOL is simply the nearest significant liquidity pool that price is gravitating toward — whether that’s a previous high with BSL resting above it, a previous low with SSL resting below it, or an old weekly level that hasn’t been swept yet. Every directional move has a target. Identifying the DOL before entering gives you a logical profit target that is grounded in where institutional order flow needs to go next.
Up Next — Day 5
Now that you understand liquidity — why it forms, where it sits, and how institutions use it — tomorrow we introduce the first entry tool that combines everything we’ve covered. Day 5 is all about Order Blocks: the institutional footprints that tell you exactly where smart money entered the market, and how to use them to time your own entries.
It’s the concept that changes how you see every candlestick chart, forever.
→ See you on Day 5.