Does the Long Straddle Earnings Strategy Actually Work?
Before I tell you whether I think this strategy works, let me explain it.
Contents
A pre-earnings long straddle is an options strategy in which an investor buys an at-the-money call and an at-the-money put option about three to four weeks before a company’s earnings announcement.
The trade is to be closed before the actual report.
This is a pre-earnings strategy that does not hold through earnings.
So the trade is to be closed before the earnings report.
It is closed either on the same day as the earnings report if it is a PM announcement.
Or it is closed on the trading day before the earnings if it is an AM announcement.
The long straddle benefits from the gradual increase in implied volatility (IV) that often builds as the earnings date approaches.
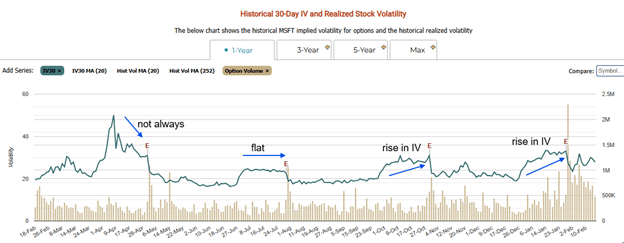
We can see this on marketchameleon.com using Microsoft (MSFT) as an example…
In the October and January earnings, we see the typical rise in IV.
The IV going into July’s earnings was flat, which can also sometimes work.
The expiration dates for the long call and long put are always the first expiration that occurs right after the earnings announcement.
This way, the uncertainty about the earning event holds up the IV of the options, and hence the value of the options.
The value of an option is correlated to its implied volatility.
The IV trend does not occur in all stocks at all times.
For example, the IV did not increase going into the April earnings.
This unusual IV behavior is because the stock was just coming out of the high volatility April sell-off.
We also note that right after the earnings event, the IV drops dramatically – a phenomenon known as IV Crush.
Because the value of the long put and call options is related to their implied volatility, a drop in IV would be a loss in value for the option.
Hence, we don’t want to hold long options going into the earnings event.
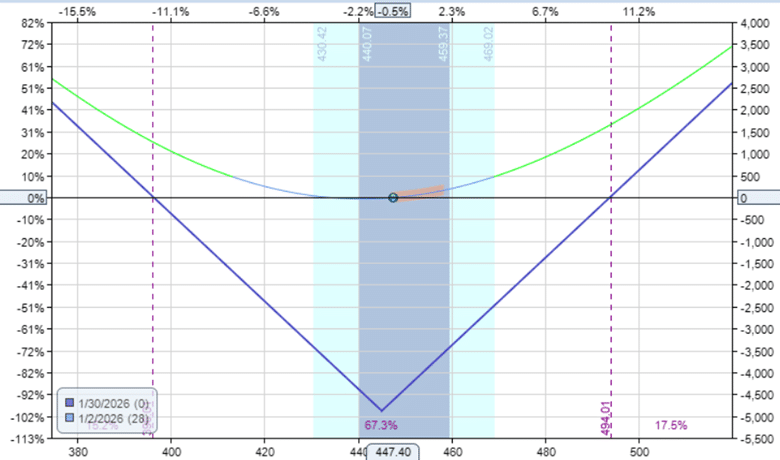
Tesla (TSLA) reports on earnings after the close on January 28th, 2026.
The investor initiates a straddle on January 2nd by buying the at-the-money call and put options expiring on January 30th.
Date: Jan 2, 2026
Price: TSLA @ $447.40
Buy one contract Jan 30 TSLA $445 call @ $26.28
Buy one contract Jan 30 TSLA $445 put @ $22.55
Net Debit: -$4883
The expiration risk graph is in blue, showing the capital at risk for this trade at $4883.
This is a defined-risk trade where the debit paid is the maximum risk in the trade.
In theory, the expiration graph shows profit going up to infinity if the price of TSLA goes up to infinity.
So it is an undefined reward trade.
It is also non-directional.
At the start of the trade,
it doesn’t matter if the TSLA price goes up or down.
The more it moves in one direction or the other, the better our profits.
While it is true, as we said, that the straddle profits from increasing IV, it actually profits much more from large price movements in the underlying, as we can see from the risk graph.
This trade gives us exposure to long volatility in both senses of the word – implied volatility and volatility of price moves.
If the market crashes, this trade would profit from a large price decline.
This long-volatility strategy can complement a portfolio of short-volatility strategies.
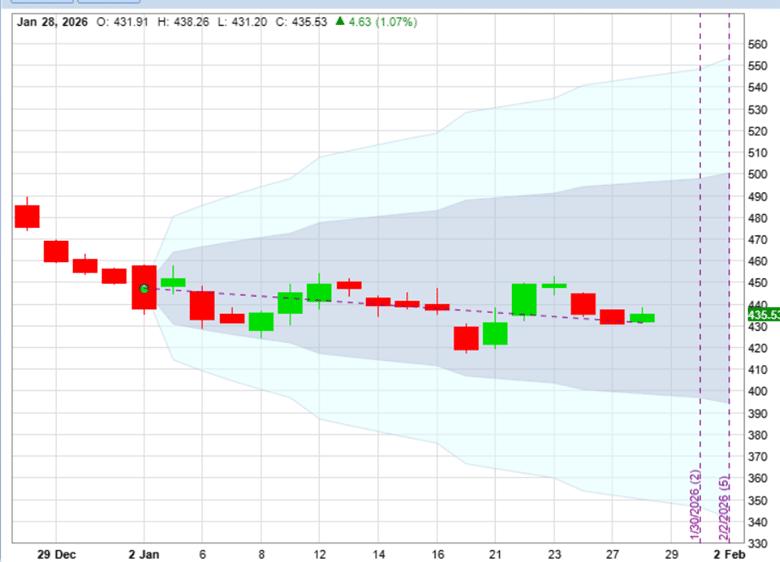
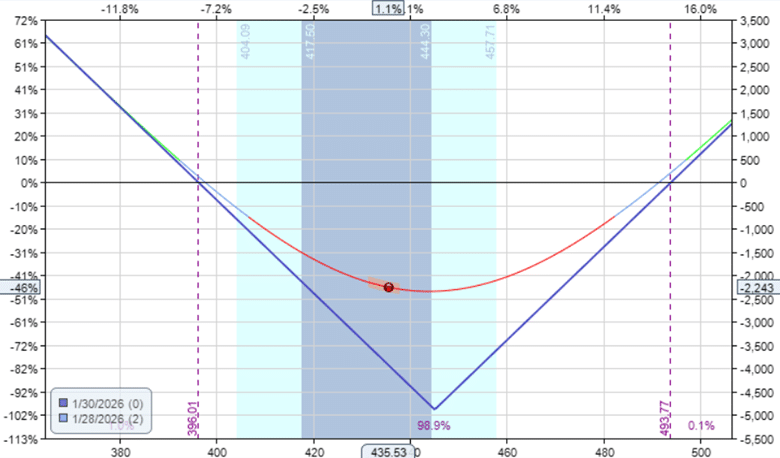
The investor exits the TSLA trade during the session of January 28th, before the earnings announcement.
A bit unusual for Tesla, but the stock went sideways…
Because it didn’t make a large move in either direction, the trade lost $2243, or 46% of the capital invested…
Long options naturally lose value each day as expiration approaches, a process known as time decay.
Because the position carries negative theta — the Greek that measures how much value an option loses with each passing day — this continual erosion works against the trade.
This daily decay becomes another drag on the position’s performance.
The key question is whether the expected rise in implied volatility leading up to earnings will be strong enough to overcome the steady drain of theta.
With the benefit of hindsight, we see that there was no rise in implied volatility for this Tesla earnings…
Therefore, the lack of IV increase, coupled with negative time decay and sideways price movement, caused the trade’s loss.
Now let’s look at a winning example.
Meta reports after the market close about the same time as Tesla’s.
If we start the straddle on January 2nd, like Tesla, the straddle would cost $ 5,470 because Meta’s price per share is $655.
To reduce this cost, we can buy the strangle instead.
Instead of buying the at-the-money call and put, the strangle would buy a slightly out-of-the-money call and a slightly out-of-the-money put.
Alternatively, we can reduce the cost of the straddle by reducing the lead time to expiration. And that’s what we will do for this example.
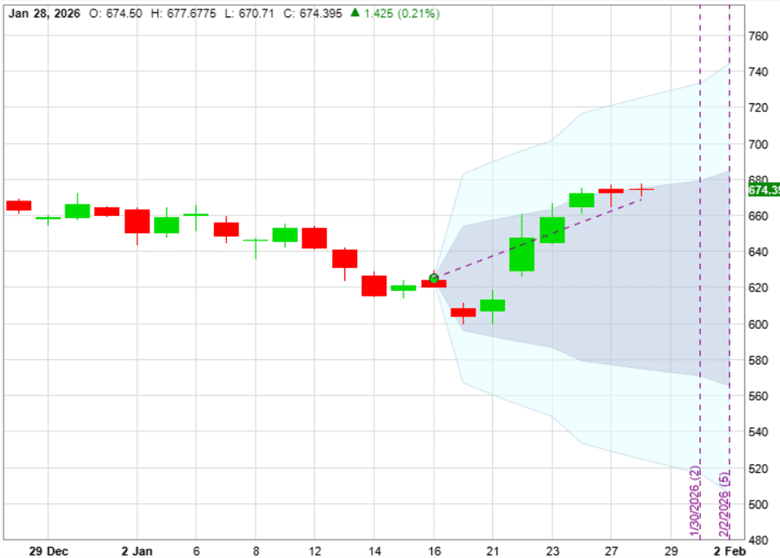
The trade starts on January 16 with only 14 days to expiration.
Date: Jan 16, 2026
Price: META @ $625
Buy one contract Jan 30 META $625 call @ $23.18
Buy one contract Jan 30 META $625 put @ $22.18
Net Debit: $4535
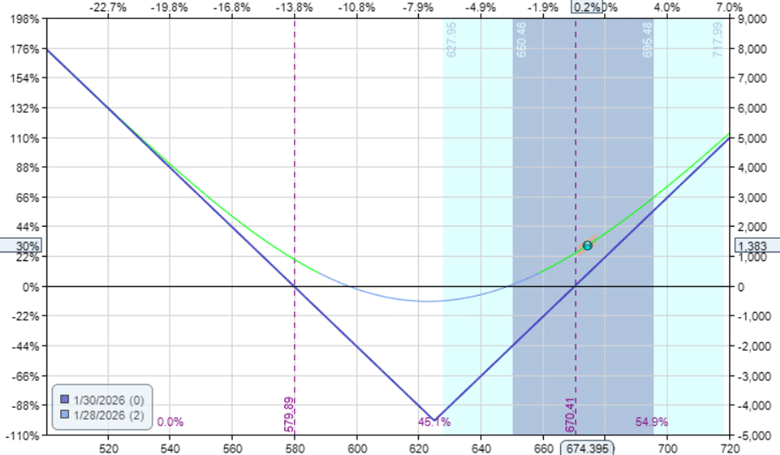
The trade exits on January 28th before earnings…
The profit was $1383, or 30% of the capital at risk.
Meta made a one-standard deviation move…
Obviously, some trades will win, and others will lose.
Now, to answer the question, does the strategy work?
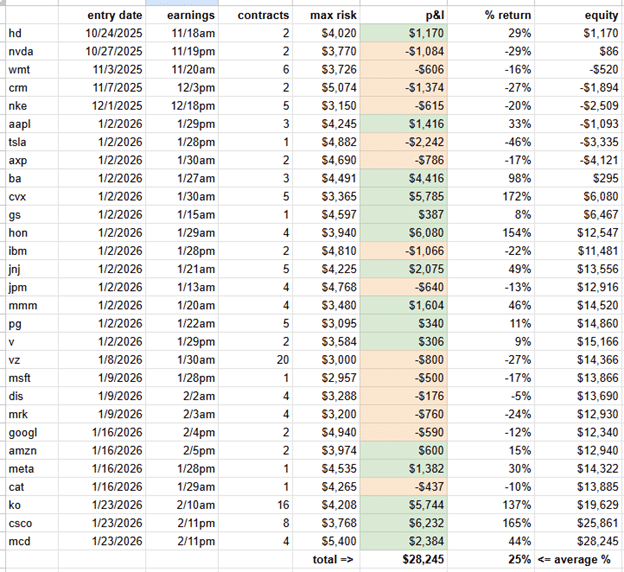
To find out, we manually repeated this process for 29 popular stocks…
We bumped up the contracts to bring the overall risk per trade to around 3k to 5k.
We also sorted the records by entry date to mimic how an investor trading through an earnings season would encounter the sequence of wins and losses.
If you were to ask the trader who made the first eight trades whether the strategy works or not, he would probably say not.
The sequence of P&L’s first eight trades would be HD, NVDA, WMT, CRM, NKE, AAPL, TSLA, and AXP.
All of them were losing trades except for HD and AAPL.
He would have seen 4 losing trades in a row.
And he would have seen the big TSLA loss of -46%, the largest in the whole table.
This is known as “sequence risk,” where the trader just happened to start the strategy during a bad losing streak.
But if we were to increase the sample size to a statistically significant amount, you can better see the statistics play out.
The average percent return of the 29 trades is a positive 25% return on capital invested.
Because this is a positive number, the strategy based on this backtest has a positive expectancy.
In other words, the strategy does work.
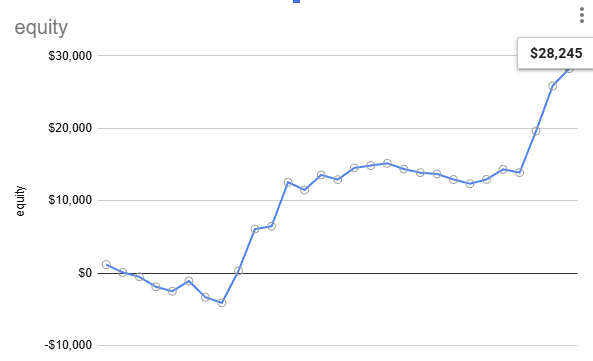
If we add up the P&Ls of all 29 trades, the net profit would be $28,245.
There are a few characteristics of this strategy that we can learn from this experiment.
It does not have a particularly high win rate.
In fact, it won only 15 trades, close to 50% wins and losses.
This also means that it can have a string of losses, which can lead to large drawdowns and be demoralizing to a trader who is not totally confident in the statistics.
It is not unusual to have 5 losses in a row.
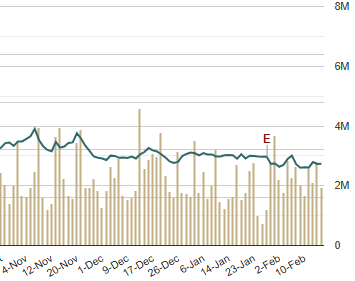
We can see any glaring drawdowns by plotting an equity curve that accumulates each P&L win and loss.
Fortunately, we don’t see any dramatic drawdowns, as most losses are small compared to some large wins.
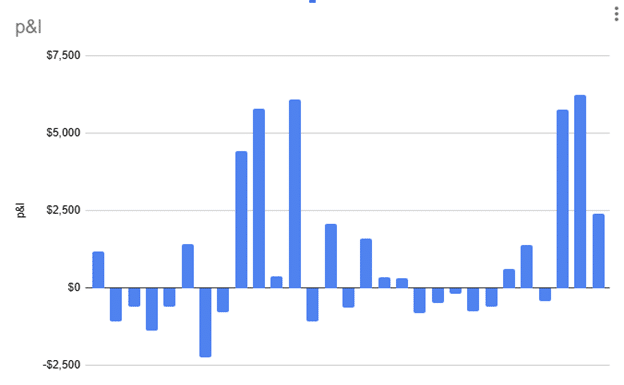
Graphing a bar chart of each of the P&L
We see that no loss exceeded $2500.
Yet there were four big wins exceeding $ 5,000.
Based on this one experiment, it appears that the long straddle pre-earnings strategy does work.
So most of the time, we get moderate losses and moderate wins in about equal amounts.
But once in a while, there are a few large wins.
It is these large wins that boost the strategy’s overall profitability.
But the trader may need to endure a series of losses and make enough trades to see these wins emerge.
This is just one experiment over a short period.
Past results may not be indicative of future outcomes as market conditions may change.
We hope you enjoyed this article on the pre-earnings long straddle.
If you have any questions, please send an email or leave a comment below.
Does the pre-earnings long straddle work?
Trade safe!
Disclaimer: The information above is for educational purposes only and should not be treated as investment advice. The strategy presented would not be suitable for investors who are not familiar with exchange traded options. Any readers interested in this strategy should do their own research and seek advice from a licensed financial adviser.

Source link