Nifty Bulls at the Gates of 26,000 as a Powerful Venus Cycle Takes Command – Bramesh’s Technical Analysis
Last Analysis can be read here
Feb 10 2026 NIFTY Expiry Forecast: Key Support & Resistance Levels for Weekly Options
Traders may watch out for potential intraday reversals at 10:29,11:28,12:22,01:11,02:11 How to Find and Trade Intraday Reversal Times
Nifty Dec Futures Open Interest Volume stood at 1.52 lakh cr , witnessing liquidation of 6.7 Lakh contracts. Additionally, the increase in Cost of Carry implies that there was closuere of SHORT positions today.
Nifty Advance Decline Ratio at 36:14 and Nifty Rollover Cost is @25405 closed above it.
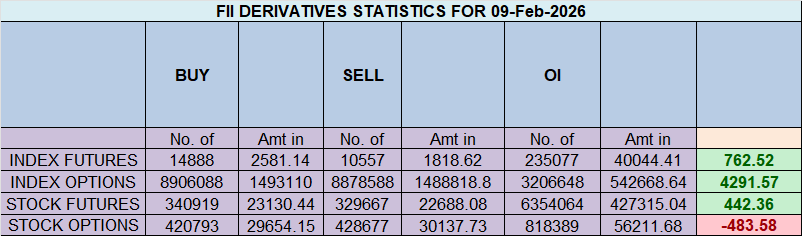
In the cash segment, Foreign Institutional Investors (FII) bought 2254.64 cr , while Domestic Institutional Investors (DII) bought 4.15 cr
The Nifty options market is radiating a strong and confident bullish sentiment, signaling that bulls have decisively taken control. A powerfully positive Put-Call Ratio (PCR) of 1.05 confirms this shift, indicating that total put open interest has surpassed call open interest. This is a classic sign of a market that has shed its fear, driven by aggressive put writers who are confidently selling downside protection and thereby building a formidable support structure beneath the index.
This bullish confidence has anchored the market around the Max Pain point of 25,800. With the current price trading slightly above this at 25,867, the market is in a position of strength, holding its ground above its financial center of gravity.
A deep dive into participant activity reveals the engine behind this rally:
-
Foreign Institutional Investors (FIIs) are the primary architects of this bullish structure. Their most significant action was being massive net sellers of put options. By selling puts on a large scale, they are building a powerful support floor, expressing high confidence that any market dips will be shallow and short-lived.
-
Retail appears to be on the other side of this trade, acting as significant buyers of these put options, indicating a continued sense of fear or a desire for hedging that is fueling the institutional premium collection.
This setup has forged a clear and formidable battlefield:
-
Resistance: A massive “Great Wall of Calls” is located at the 26,000 psychological strike, which serves as the ultimate ceiling.
-
Support: A powerful support floor, reinforced by FII put selling, has been built at the 25,700 strike. The 25,800 Max Pain level will also act as a crucial pivot.
In conclusion, the Nifty is in a strong, institutionally-backed “buy on dips” environment. The path of least resistance is upwards, with the bulls now set to challenge the final fortress at 26,000.
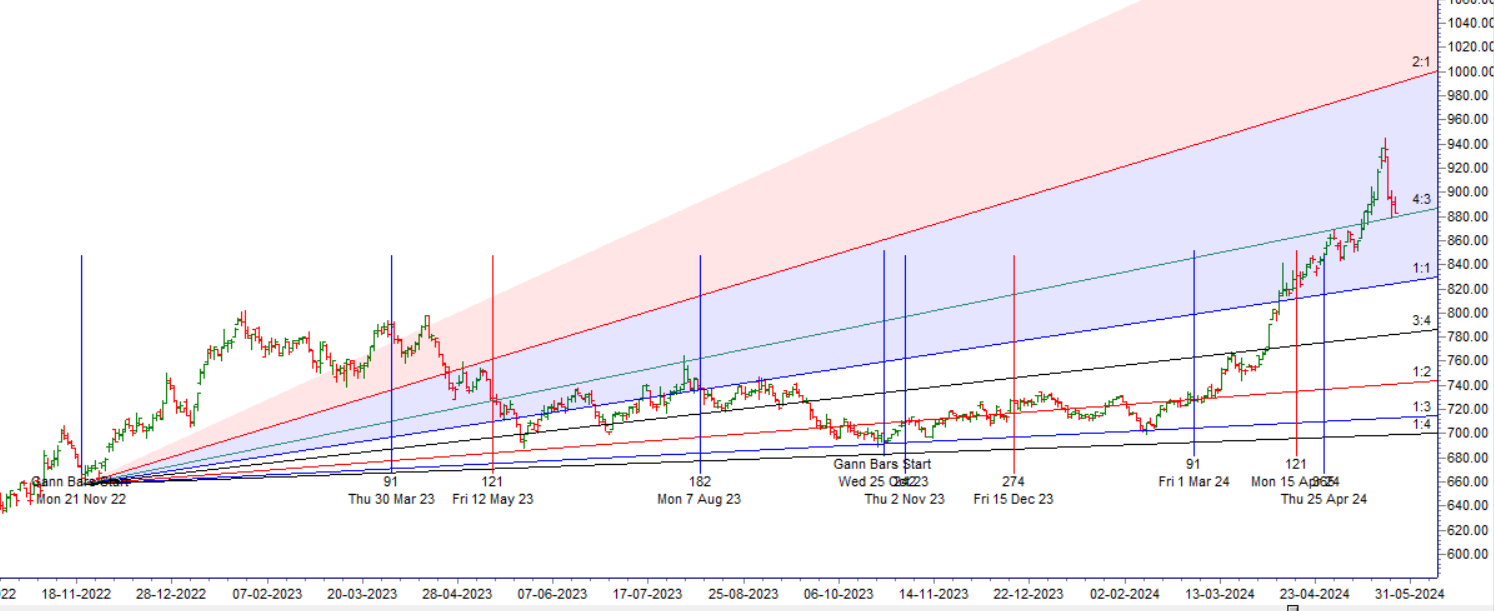
For Positional Traders, The Nifty Futures’ Trend Change Level is At 25515. Going Long Or Short Above Or Below This Level Can Help Them Stay On The Same Side As Institutions, With A Higher Risk-reward Ratio. Intraday Traders Can Keep An Eye On 25900 , Which Acts As An Intraday Trend Change Level.
Nifty Spot – Intraday Chart Observation
Technical Setup: The index is approaching critical breakout levels. Watch these zones for price action confirmation:
-
Strength (Upside): Momentum is expected to pick up if Nifty sustains above 25900. In this scenario, the immediate resistance levels are 25945, 25972 and 26016.
-
Weakness (Downside): The trend technically weakens if the index slips below 25850 This could open the path towards support levels at 25816, 25777 and 25729.
Nifty Expiry Range
Upper End of Expiry : 26028
Lower End of Expiry : 25697
Wishing you good health and trading success as always.As always, prioritize your health and trade with caution.
As always, it’s essential to closely monitor market movements and make informed decisions based on a well-thought-out trading plan and risk management strategy. Market conditions can change rapidly, and it’s crucial to be adaptable and cautious in your approach.
► Join Youtube channel : Click here
► Check out Gann Course Details: W.D. Gann Trading Strategies
► Check out Financial Astrology Course Details: Trading Using Financial Astrology
► Check out Gann Astro Indicators Details: Gann Astro Indicators