Nifty Forms a Coiled Spring: Back-to-Back NR7 Patterns Signal an Imminent Breakout
FIIs Play a Deceptive Hand, Luring Bulls as Their Bearish Grip Tightens
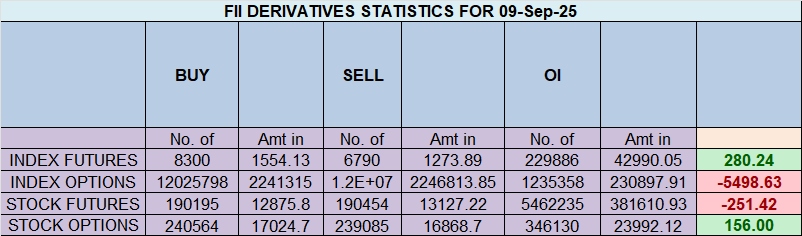
On the trading session of 9th September 2025, the Nifty Index Futures market presented a fascinating and potentially deceptive picture. On the surface, Foreign Institutional Investors (FIIs) appeared bullish, with net buying of 1,786 contracts amounting to a significant ₹334 crores. This activity was accompanied by a healthy increase in net open interest of 2,014 contracts, signaling that fresh capital is entering the market rather than just the squaring off of old positions. However, a deeper dive into the data reveals a classic “smart money” maneuver, where the headline action masks a deeply entrenched bearish conviction.
Decoding the FII Strategy
While the net buying figure might excite the bulls, the breakdown of FII activity tells a more nuanced story. FIIs added 1,825 long contracts, but they also added 315 short contracts. This indicates that while they may be engaging in some tactical buying or short-covering at specific levels, their primary strategy has not changed. The addition of fresh shorts, even in a smaller quantity, shows they are not abandoning their bearish outlook. This daily buying could be a calculated move to create liquidity, defend crucial levels where their massive short positions are concentrated, or, most cunningly, to engineer a “bull trap” designed to pull in retail participants on the long side before a potential subsequent move downwards.
Retail Nerves Begin to Show
In stark contrast, the behavior of the Client segment (retail traders) paints a picture of growing anxiety. Clients were seen covering 292 long contracts, indicating a reduction in bullish conviction. Simultaneously, they added 386 short contracts, suggesting a belated attempt to join the downtrend or hedge their vulnerable long positions. This is classic “weak hand” behavior—selling into minor dips and adding shorts after a significant portion of the move may have already occurred. Despite these adjustments, their overall positioning remains dangerously lopsided.
The Glaring Divergence: Positioning Tells the Real Story
The most critical insight comes from the overall positioning in Index Futures. The FII Long/Short ratio stands at an extremely bearish 0.09. This means for every 9 long contracts, the FIIs hold a staggering 91 short contracts. They are overwhelmingly positioned for a significant correction or downside move in the Nifty.
Conversely, the Client Long/Short ratio is at a highly bullish 2.53, translating to a positioning of 72% long and only 28% short. This creates a classic and dangerous standoff: the “smart money” is positioned on one side of the boat, while the retail “crowd” is heavily concentrated on the other. History has shown that such extreme divergences rarely resolve in favor of the retail segment. The large pool of vulnerable retail longs provides the very fuel FIIs need to profit from their short positions, as any significant break of support levels could trigger a cascade of stop-losses and forced selling.
In conclusion, traders should not be misled by the single-day FII buying figure. The overwhelming evidence from their net positioning points to a deeply bearish outlook. The current market structure suggests that any rally is likely to be sold into, and the risk of a sharp downside move remains exceptionally high as long as this extreme divergence in positioning persists. The smart money has laid its trap; the prudent trader would be wise not to walk into it.
Last Analysis can be read here
The Nifty index is currently in a state of extreme compression, painting a classic picture of indecision that often precedes a significant, high-velocity move. For the second consecutive day, the index has formed an NR7 pattern, which signifies the narrowest trading range of the last seven sessions. This coiling of price action indicates a temporary equilibrium between bulls and bears, a standoff that is unlikely to last.
On the surface, the bulls appeared to have the upper hand today. The market’s advance was spearheaded by IT heavyweight Infosys, which rallied on the positive news of a share buyback announcement. This, combined with a favorable macro tailwind from a GST rate cut, should have provided enough fuel for a decisive upward thrust.
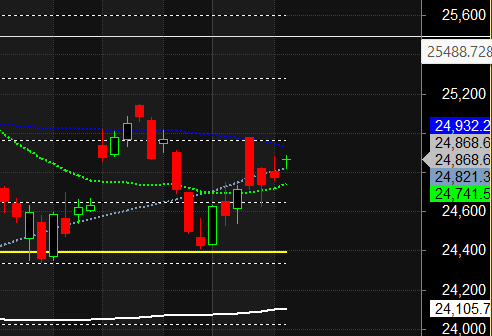
However, the reality was far more telling. Despite these clear positive catalysts, the Nifty faltered and failed to surmount the critical resistance zone of 24950-25000. This struggle at higher levels is a significant red flag, strongly suggesting the presence of aggressive selling pressure. Every attempt to rally is being met with a fresh supply of shares, effectively capping the upside for now.
The technical battle lines are now drawn with crystal clarity, providing a clear roadmap for traders:
-
The Bullish Trigger: For the bulls to seize control and make a credible attempt to take out the recent swing high formed during the lunar eclipse, they must secure a decisive close above 24900. A close above this level would signal that the selling pressure has been absorbed and would open the door for a new leg of the rally.
-
The Bearish Trigger: On the flip side, the immediate support level to watch is 24800. If sellers manage to push the Nifty below this level on a closing basis, it would invalidate the recent bullish structure. Such a breakdown would likely trigger a cascade of stop-losses, leading to a quick and sharp fall as the coiled energy is released to the downside.
In conclusion, traders should be on high alert. The back-to-back NR7 patterns are a clear signal to prepare for a significant expansion in volatility. The current narrow range is not a time for complacency but for planning. The direction of the market’s next major move will likely be determined by a breakout above 24900 or a breakdown below 24800.
Nifty Trade Plan for Positional Trade ,Bulls will get active above 24900 for a move towards 24969/25047. Bears will get active below 24814 for a move towards 24729/24660
Traders may watch out for potential intraday reversals at 10:42,11:31,12:34,02:08,02:40 How to Find and Trade Intraday Reversal Times
Nifty Sep Futures Open Interest Volume stood at 1.69 lakh cr , witnessing liquidation of 0.04 Lakh contracts. Additionally, the increase in Cost of Carry implies that there was covering of SHORT positions today.
Nifty Advance Decline Ratio at 31:19 and Nifty Rollover Cost is @24980 closed below it.
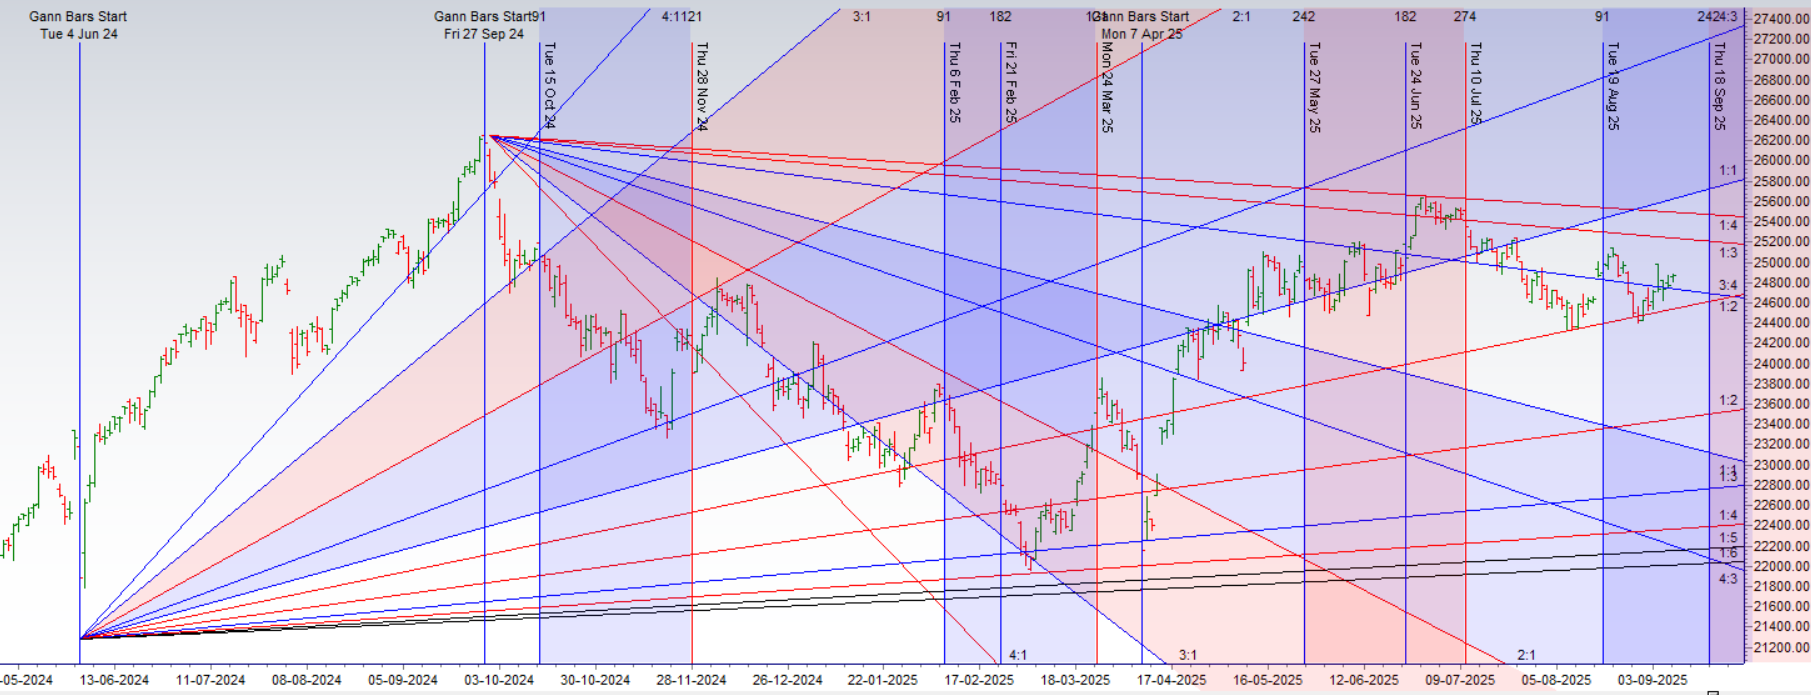
Nifty Gann Monthly Trend Change level 24678 closed above it.
Nifty has closed above its 20 SMA @ 24723 Trend is Sell on Rise till below 25000
Nifty options chain shows that the maximum pain point is at 24850 and the put-call ratio (PCR) is at 1.17 .Typically, when the PCR open interest ranges between 0.90 and 1.05, the market tends to remain range-bound.
In the cash segment, Foreign Institutional Investors (FII) bought 2050 cr , while Domestic Institutional Investors (DII) bought 83 cr.
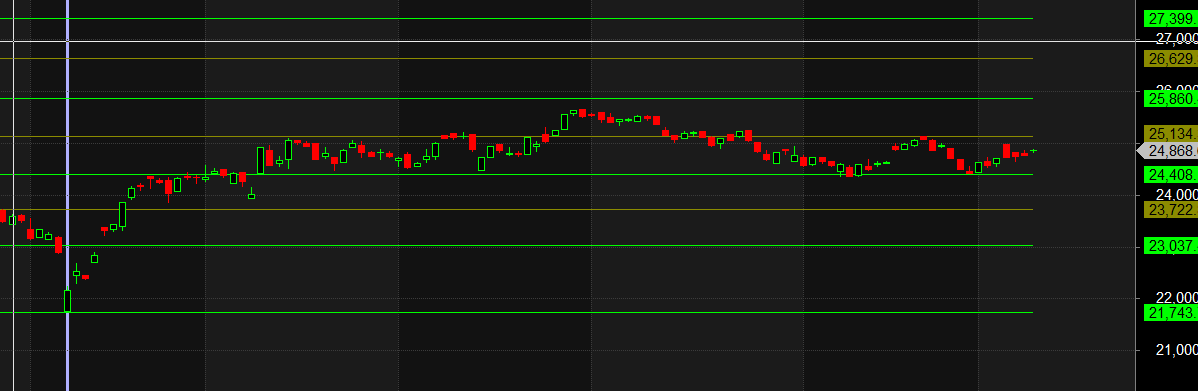
Traders who follow the musical octave trading path may find valuable insights in predicting Nifty’s movements. According to this path, Nifty may follow a path of 23037-23722-24408-25134-25860 This means that traders can take a position and potentially ride the move as Nifty moves through these levels.Of course, it’s important to keep in mind that trading is inherently risky and market movements can be unpredictable.
the most profitable traders will tell you that the true mastery lies not in understanding the market, but in understanding yourself.
For Positional Traders, The Nifty Futures’ Trend Change Level is At 24799. Going Long Or Short Above Or Below This Level Can Help Them Stay On The Same Side As Institutions, With A Higher Risk-reward Ratio. Intraday Traders Can Keep An Eye On 24945 , Which Acts As An Intraday Trend Change Level.
Nifty Intraday Trading Levels
Buy Above 24888 Tgt 24925, 24960 and 25005 ( Nifty Spot Levels)
Sell Below 24814 Tgt 24777, 24729 and 24700 (Nifty Spot Levels)
Wishing you good health and trading success as always.As always, prioritize your health and trade with caution.
As always, it’s essential to closely monitor market movements and make informed decisions based on a well-thought-out trading plan and risk management strategy. Market conditions can change rapidly, and it’s crucial to be adaptable and cautious in your approach.
► Join Youtube channel : Click here
► Check out Gann Course Details: W.D. Gann Trading Strategies
► Check out Financial Astrology Course Details: Trading Using Financial Astrology
► Check out Gann Astro Indicators Details: Gann Astro Indicators
Related
Source link