March Series Setup: Why FIIs are Aggressively Long and the Gann Dates to Watch
Here is a deep dive into the March series setup, combining historical data, the latest FII positioning, and the recent market cycle.
1. Historical Performance: A Seasonality Edge
In the world of trading, seasonality is a wind at your back. Looking at the last five years, the Nifty has shown a consistent tendency to rally in March—with 2021 being the sole outlier.
The Insight: With 4 out of the last 5 years ending in the green, the bias is positive. The average move across these five years is approximately +779 points, though volatility has been compressing since 2022.
2. Recent Market Cycle: From Distribution to Recovery
Analyzing the recent monthly moves reveals a classic market evolution. We have moved through the “pain” phase and are now entering what looks like a new trend.
-
Oct: Strong Positive (Peak)
-
Nov: Mild Positive (Topping out)
-
Dec: Slight Negative (Initial Distribution)
-
Jan: Weak (Full Consolidation)
-
Feb: Recovery (Early Rebound)
Interpretation: The market has successfully navigated a phase of Distribution → Consolidation → Early Recovery. This positions the March series as a “Continuation Phase,” where the recovery seen in February attempts to turn into a sustained trend.
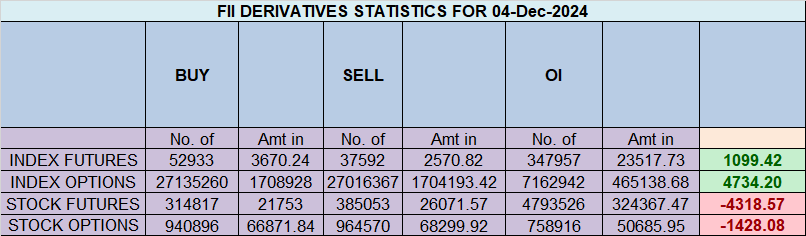
3. F&O Positioning: The FII “Long” Surge
Foreign Institutional Investors (FIIs) are finally putting their money where their mouth is.
FII Long Exposure (Index Futures):
-
January: 9%
-
February: 12%
-
March: 21%
Interpretation: A sharp increase to 21% marks a significant shift. FIIs are adding aggressive directional exposure into March. While not yet at “overcrowded” levels, the momentum of the build-up is decidedly bullish.
Nifty Rollovers:
-
Current: 68%
-
Previous: 71%
Interpretation: Slightly lower rollovers suggest selective positioning. Traders are not fully committed across every sector; they are being surgical, likely rotating out of weak sectors and into those showing momentum.
4. Key Triggers: The Macro Overlay
The March series is “Event-Heavy,” meaning price action will be sensitive to:
-
Global Policy: Trump’s tariff comments and the State of the Union address are keeping the “Global Overlay” volatile.
-
Geopolitics: US–Iran talks will dictate crude oil prices and Rupee stability.
-
Domestic Data: Insurance and vehicle sales will provide the fundamental backing to the technical move.
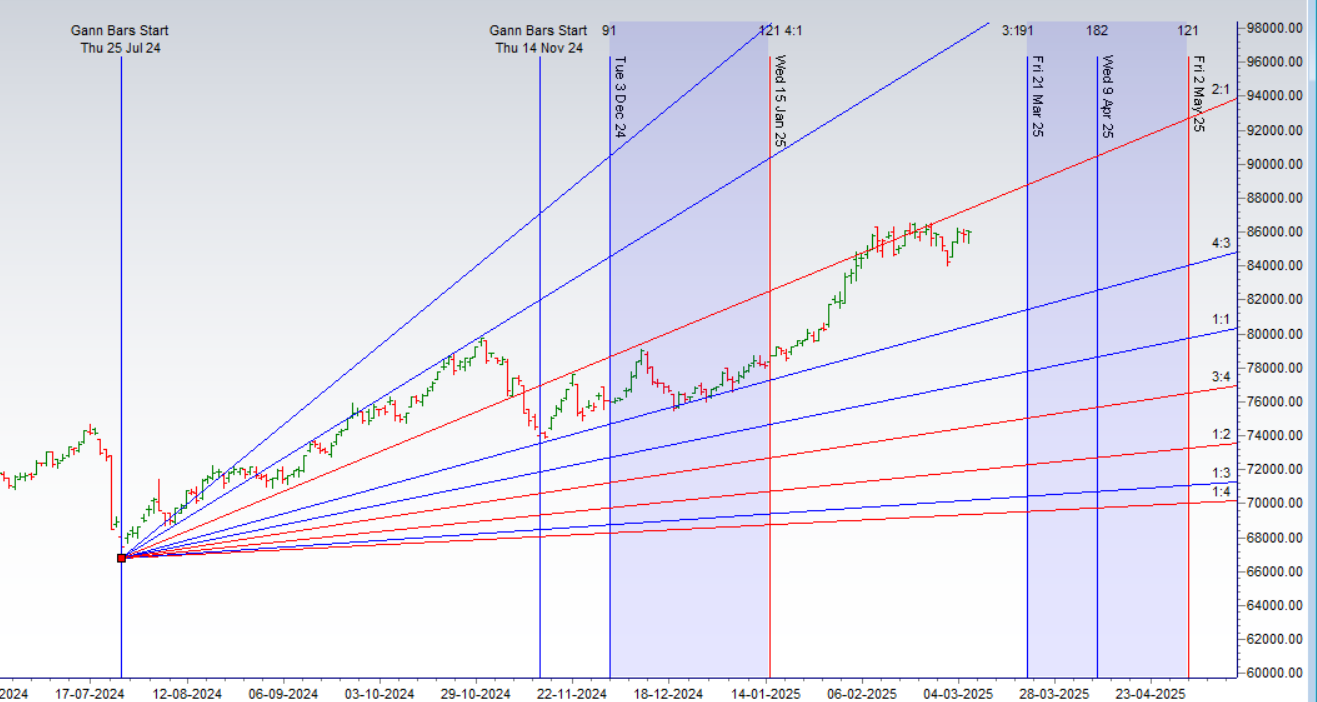
5. Critical Gann Time Turn Dates
Watch for sharp trend changes on these specific dates ( 1 trading day):
-
March 4th (Main 55-Day Cycle): This is the most critical date for the first half of the series. The market is currently under “cycle pressure” until this date. A breakout or breakdown on March 4th usually dictates the trend for the next 5-7 days.
-
March 11th (The Setup): Often marks a minor swing high or low where the “smart money” resets their positions.
-
March 19th (The V-Bottom / Magnetic Low): Based on the Jupiter Direct cycle and historical lunar clusters, this date is a high-probability “Trend Reversal” point. If the market is falling into this date, look for a sharp recovery (V-Bottom).
6. Nifty Gann Square of 9: Price Targets
Based on the current price action, these are the “natural” mathematical levels for the March series: