Oil WTI Technical Analysis: Short-Term Bounce Faces Long-Term Pressure – ForexNews.PRO
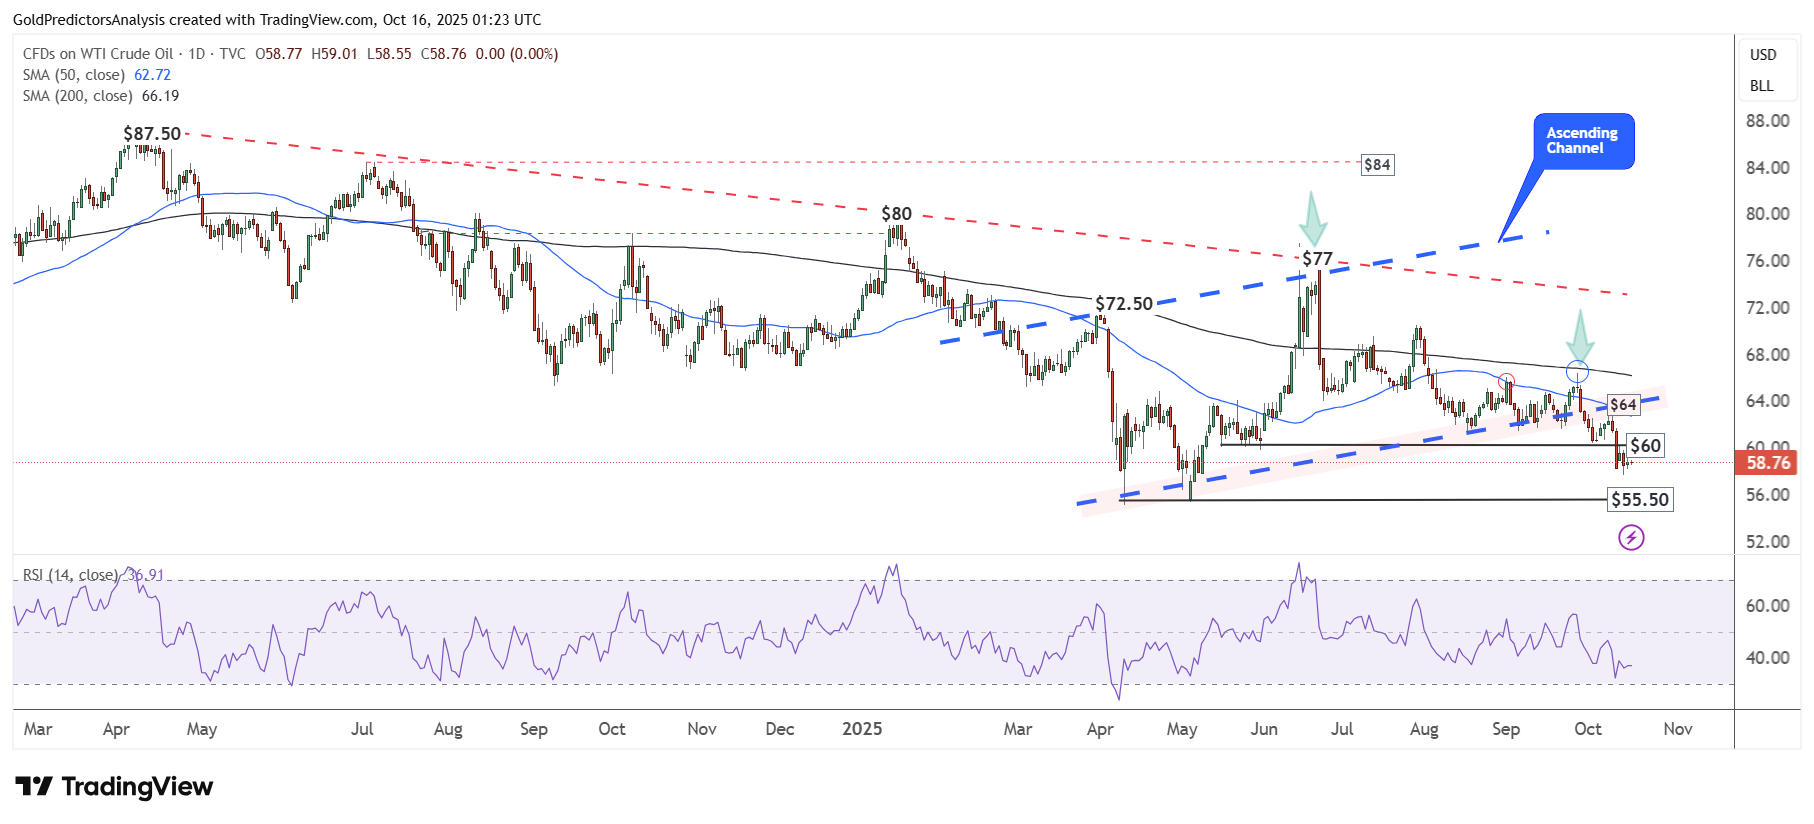

The daily chart from WTI crude oil (CL) shows that the price is consolidating after breaking below the $60 level, showing negative price action. Any rebound toward the $60–$64 area may be capped and followed by another downturn.
Immediate support lies at $55.50, and a break below this level could trigger strong selling pressure in oil prices.
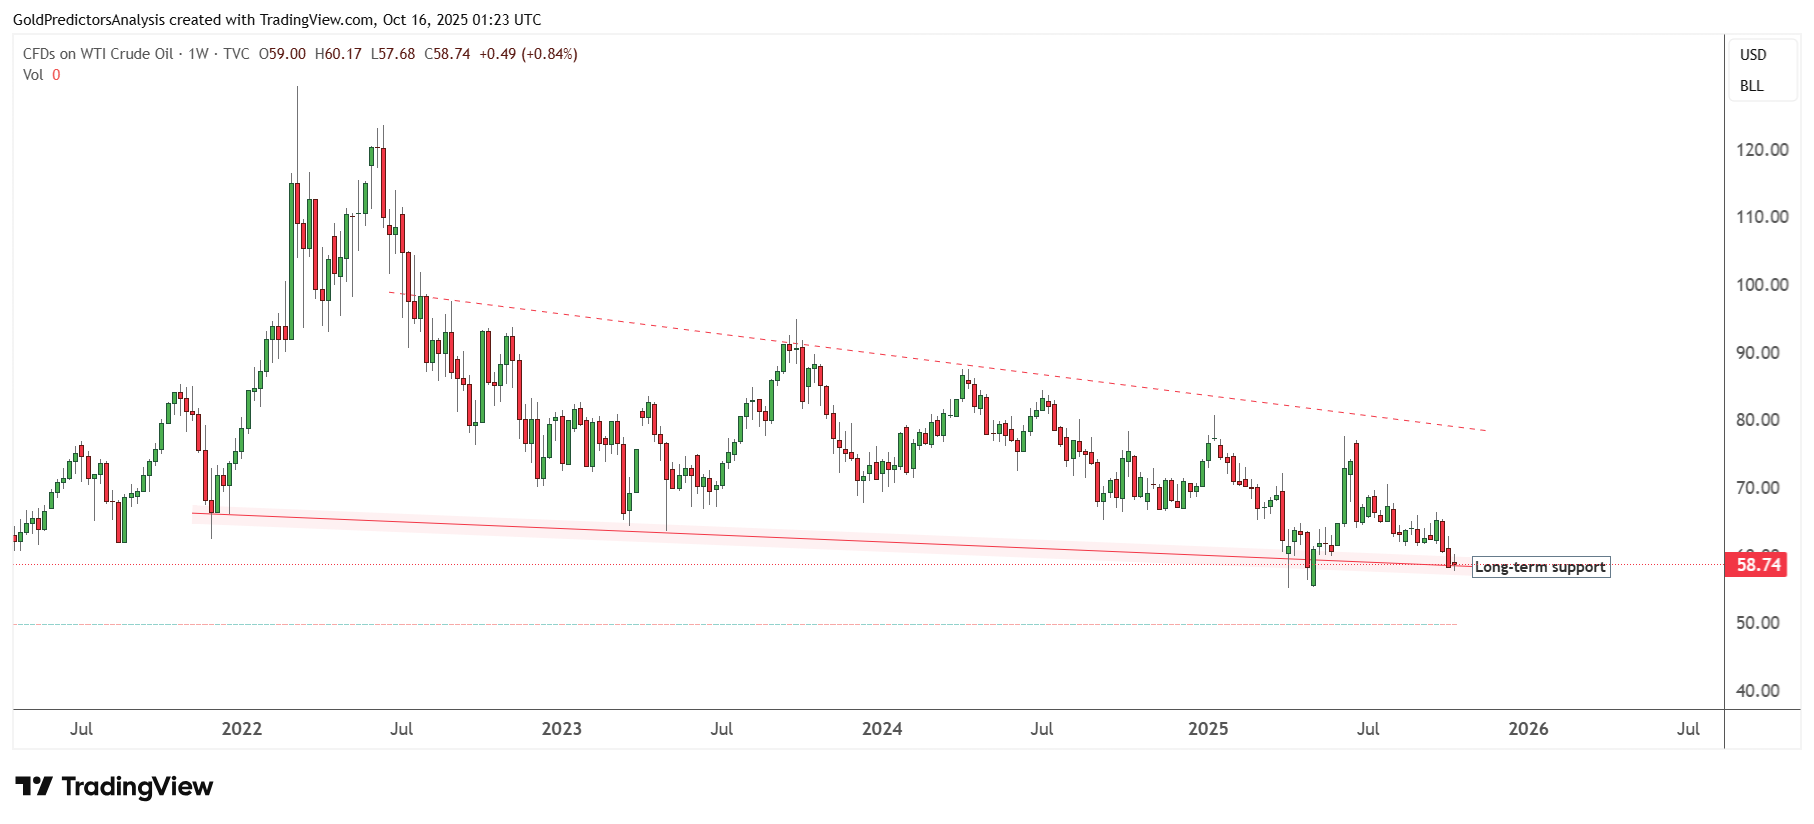
Despite the breakout below the $60 support on the daily chart, WTI oil remains under pressure. The weekly chart shows the price is still consolidating within the long-term support zone between $55 and $60. Although oil has broken below the $60 level, a decisive break below $55 is needed to trigger strong selling pressure in the market.
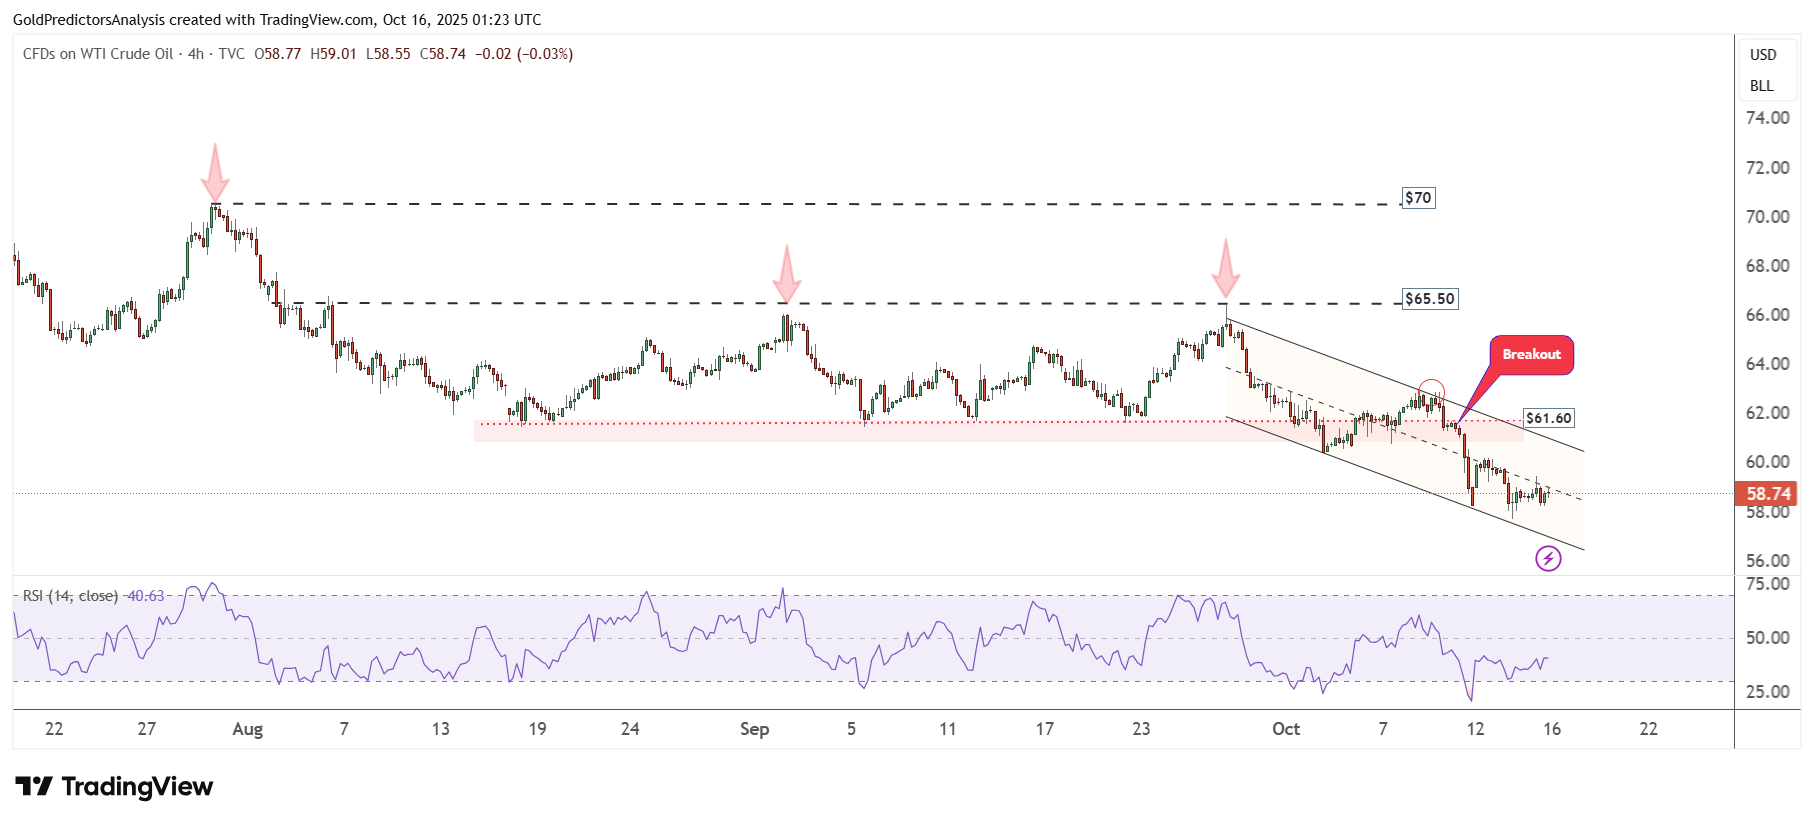
WTI Oil 4-Hour Chart – Negative Price Action
The 4-hour chart for WTI oil shows that the price is consolidating within a tight range and displaying negative price action after breaking below the $61.60 level. However, the formation of a descending channel after the breakout suggests that any rebound toward the $60–$62 region could serve as a selling opportunity in the oil market.

Source link