Big Win for Oklo! How Their Landmark Agreement Is Driving Investor Buzz 📈
Oklo, an innovative player in the nuclear energy sector, recently announced a landmark deal that has propelled it into the spotlight. This agreement and subsequent market developments have caught the attention of investors and analysts, signaling significant potential for the company in the clean energy market.
Oklo’s Historic Agreement with Switch
On December 18, Oklo revealed a non-binding agreement to supply 12 gigawatts of power to Switch, a leading provider of AI, cloud, and enterprise data centers. This contract, extending through 2044, has been hailed as one of the largest corporate clean power deals ever signed.
The announcement underscores Oklo’s ambition to serve as a pivotal energy provider for data centers—a sector experiencing exponential growth due to the surge in AI and cloud computing demand. The deal positions Oklo as a key player in the transition toward clean and sustainable energy solutions.
Switch’s focus on AI and cloud data centers represents a fast-growing market, and Oklo’s ability to secure a long-term contract with such a prominent client highlights its potential to meet the increasing demand for reliable, clean energy.
Positive Analyst Coverage Fuels Optimism
On December 19, Wedbush initiated coverage of Oklo with an “outperform” rating and a price target of $26.00. This bullish outlook reflects the company’s promising position within the clean energy and data center sectors.
Analysts are optimistic about Oklo’s innovative approach to nuclear power, particularly its small modular reactors (SMRs), which offer a scalable and sustainable energy solution. This endorsement from a leading financial firm has further bolstered investor confidence.
Positive analyst sentiment often translates to increased market confidence. Wedbush’s favorable outlook signals that industry experts see significant growth potential for Oklo, making it a stock worth watching.
Rising Energy Demands from AI and Data Centers
Oklo is strategically positioning itself to capitalize on the surging energy needs driven by the AI boom. As data centers become increasingly vital to technological advancement, their energy consumption grows exponentially. Nuclear power, with its clean and reliable characteristics, is seen as a practical solution to meet these demands.
By aligning its business with the energy-intensive AI and cloud computing industries, Oklo is tapping into a lucrative and rapidly expanding market.
AI and data centers are at the forefront of technological innovation, making them critical drivers of energy demand. Oklo’s ability to cater to these sectors enhances its growth prospects and appeal to forward-looking investors.
Increased Trading Volume Reflects Investor Interest
On December 19, Oklo’s stock experienced a surge in trading volume, with over 4.7 million shares traded by mid-day. This heightened activity reflects a growing interest among investors who see potential in the company’s innovative approach and recent achievements.
The strong trading volume signals confidence in Oklo’s trajectory, even as it faces challenges common to pre-revenue companies in highly regulated industries like nuclear energy.
High trading volume often indicates strong investor interest and optimism about a company’s future. For Oklo, this could mean sustained attention and potential for upward stock movement.
Challenges and Market Position
While Oklo’s achievements and strategic positioning are impressive, the company remains in a pre-revenue stage and faces significant regulatory hurdles. Its future success will hinge on its ability to execute its business plan effectively and navigate the complexities of the nuclear energy landscape.
Despite these challenges, Oklo’s focus on small modular reactors (SMRs) and its ability to secure large-scale agreements, such as the deal with Switch, place it in a strong position to benefit from the ongoing AI revolution.
Oklo’s innovative approach and ability to secure key partnerships demonstrate its potential as a leader in sustainable energy solutions. However, investors should remain mindful of the regulatory and operational challenges the company must overcome.
Oklo Stock Trading Plan
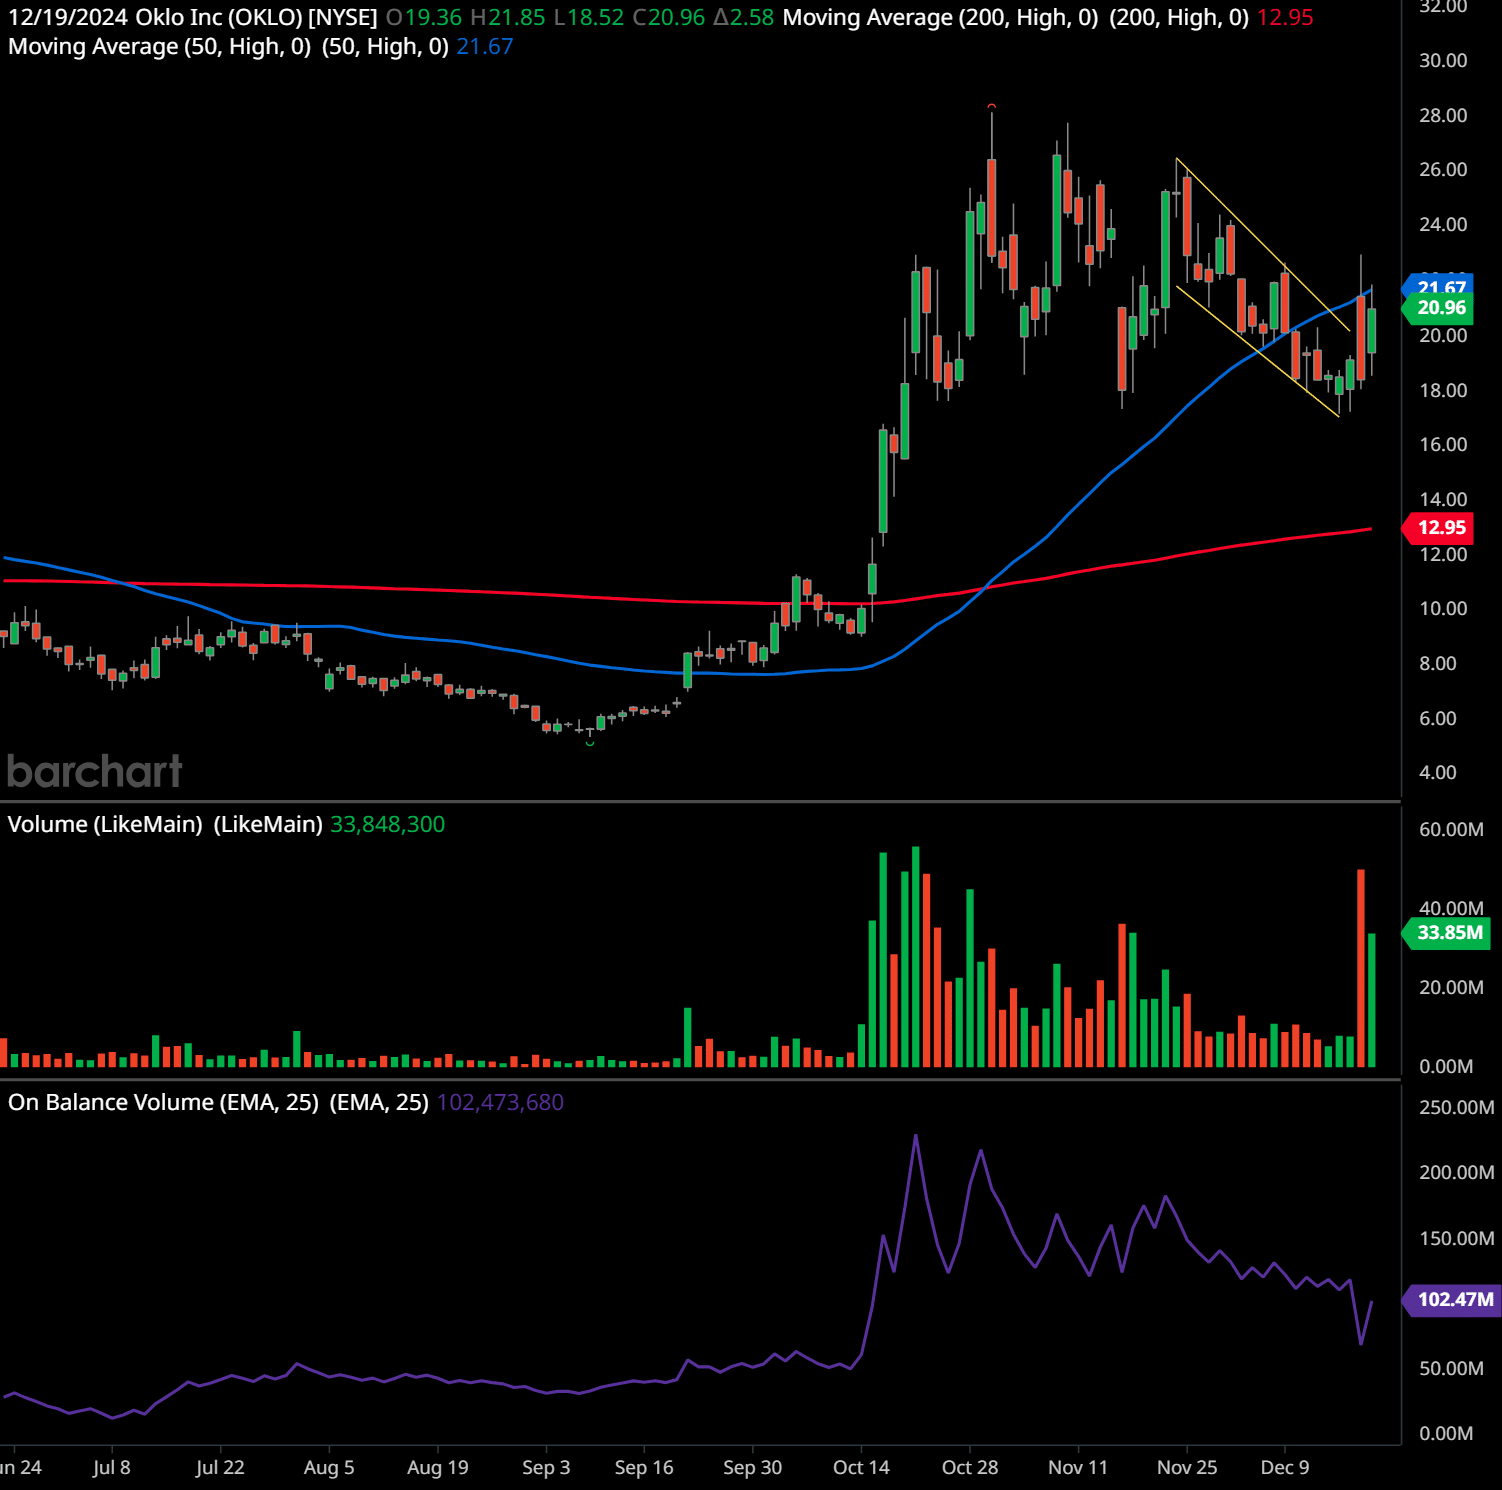
The chart for Oklo Inc. (OKLO) in the daily timeframe reveals several important technical features that can be analyzed for potential future price action.
Support and Resistance Levels:
- Support Levels: The most evident support level is around $12.95, where the 200-day moving averageThe concept of moving averages dates back to the early 20th century. While it is challenging to attribute the invention of moving averages to a single individual, W. P. Hamilton, a… lies. This level also aligns with a previous consolidation zone from earlier price action.
- Resistance Levels: The stock has a notable resistance around $26.00, where multiple candles failed to close above, indicating selling pressure. An intermediate resistance level is around $21.67, which is close to the current 50-day moving averageThe concept of moving averages dates back to the early 20th century. While it is challenging to attribute the invention of moving averages to a single individual, W. P. Hamilton, a….
Chart Patterns:
- The chart shows a descending channel (flag or wedgeThe wedge chart pattern is a technical analysis tool used by traders to identify potential buying or selling opportunities. It consists of three converging trend lines, which meet … pattern) formed after a significant rally, which could indicate a continuation pattern. The recent breakoutBreakout patterns occur when a stock price moves beyond a defined level of support or resistance with increased volume, signaling the potential start of a new trend. A breakout ind… above this channel signals potential bullish momentum.
- There is evidence of a strong upward trend from mid-September to October, followed by consolidation and retracement, which aligns with a healthy corrective phase in a bullish cycle.
Trend Analysis:
- The overall trend since mid-2024 has been bullish, with a notable breakoutBreakout patterns occur when a stock price moves beyond a defined level of support or resistance with increased volume, signaling the potential start of a new trend. A breakout ind… above the 200-day moving averageThe concept of moving averages dates back to the early 20th century. While it is challenging to attribute the invention of moving averages to a single individual, W. P. Hamilton, a… in late September, confirming the shift in sentiment.
- The 50-day moving averageThe concept of moving averages dates back to the early 20th century. While it is challenging to attribute the invention of moving averages to a single individual, W. P. Hamilton, a… is currently above the 200-day moving averageThe concept of moving averages dates back to the early 20th century. While it is challenging to attribute the invention of moving averages to a single individual, W. P. Hamilton, a…, signaling a golden crossWhen the 50 day moving average crosses above the 200 day moving average, it is called a Resurrection Cross. Conversely, when the 50 day moving average crosses below the 200 day mov… that reinforces the bullish trend.
- The recent breakoutBreakout patterns occur when a stock price moves beyond a defined level of support or resistance with increased volume, signaling the potential start of a new trend. A breakout ind… above the 50-day moving averageThe concept of moving averages dates back to the early 20th century. While it is challenging to attribute the invention of moving averages to a single individual, W. P. Hamilton, a… after a pullback indicates renewed bullishness.
Indicators:
- Volume: A spike in volume during the breakoutBreakout patterns occur when a stock price moves beyond a defined level of support or resistance with increased volume, signaling the potential start of a new trend. A breakout ind… suggests strong buyer interest. However, lower volumes during the pullback align with a healthy correction.
- On-Balance VolumeThe On Balance Volume indicator (OBV) is a technical analysis tool used to measure the flow of money into and out of a security over a specified period of time. It is a cumulative … (OBVThe On Balance Volume indicator (OBV) is a technical analysis tool used to measure the flow of money into and out of a security over a specified period of time. It is a cumulative …): The OBVThe On Balance Volume indicator (OBV) is a technical analysis tool used to measure the flow of money into and out of a security over a specified period of time. It is a cumulative … remains elevated, suggesting accumulation despite the recent retracement. This aligns with a bullish outlook.
- Moving AveragesThe concept of moving averages dates back to the early 20th century. While it is challenging to attribute the invention of moving averages to a single individual, W. P. Hamilton, a…: The stock trading above both moving averagesThe concept of moving averages dates back to the early 20th century. While it is challenging to attribute the invention of moving averages to a single individual, W. P. Hamilton, a… (especially after testing the 50-day moving averageThe concept of moving averages dates back to the early 20th century. While it is challenging to attribute the invention of moving averages to a single individual, W. P. Hamilton, a…) indicates strength.
Future Trends:
- If the stock maintains its momentum above $21.67, it may retest the $26.00 resistance. A successful breakoutBreakout patterns occur when a stock price moves beyond a defined level of support or resistance with increased volume, signaling the potential start of a new trend. A breakout ind… above this level could target new highs, with potential near $30.00.
- A failure to sustain the breakoutBreakout patterns occur when a stock price moves beyond a defined level of support or resistance with increased volume, signaling the potential start of a new trend. A breakout ind… may see the stock retesting the $18.00 support or even the 200-day moving averageThe concept of moving averages dates back to the early 20th century. While it is challenging to attribute the invention of moving averages to a single individual, W. P. Hamilton, a… at $12.95.
Stock Trading Plans:
- Swing Trading Plan:
- Entry: Enter above $21.67 with strong volume confirmation.
- Target: First target at $26.00 and second target at $30.00.
- Stop Loss: Set a stop loss just below $20.00 to limit downside risk.
- Exit: Exit upon hitting resistance or signs of reversal, especially near $26.00.
- Long-Term Trading Plan:
- Entry: Accumulate on pullbacks near $18.00 to $20.00 levels, aligning with moving averageThe concept of moving averages dates back to the early 20th century. While it is challenging to attribute the invention of moving averages to a single individual, W. P. Hamilton, a… support.
- Target: Long-term target above $30.00 if the stock maintains its uptrend.
- Stop Loss: Place a wide stop loss below the 200-day moving averageThe concept of moving averages dates back to the early 20th century. While it is challenging to attribute the invention of moving averages to a single individual, W. P. Hamilton, a… at $12.00.
- Strategy: Monitor fundamental developments and macroeconomic trends to adjust positions accordingly.
Past performance is not an indication of future results. This article should not be considered as investment advice. Always conduct your own research and consider consulting with a financial advisor before making any investment decisions. 🧡
Looking Ahead
Oklo’s recent developments highlight its potential to become a significant player in the clean energy market. The company’s historic agreement with Switch, coupled with positive analyst coverage and strategic alignment with AI and data center demands, positions it for substantial growth.
While challenges remain, Oklo’s focus on innovation and sustainability makes it a compelling company for investors seeking exposure to the clean energy revolution. With the global shift toward greener technologies, Oklo’s progress could signal the start of a transformative journey in the energy sector.
Do you have a news tip for GuerillaStockTrading? Please email us at
[email protected]
💥 GET OUR LATEST CONTENT IN YOUR RSS FEED READER
We are entirely supported by readers like you. Thank you.🧡
At GuerillaStockTrading, we maintain full transparency and impartiality; we never blog about stocks or crypto in which we hold a personal position unless explicitly stated in the article. Additionally, we do not accept paid promotions presented as content. All information shared is for informational purposes only and should not be construed as financial, investment, tax, or legal advice, nor as a recommendation to buy any security or financial asset. The content is general in nature and does not account for individual circumstances. It may not be suitable for your particular situation. Before making financial decisions, you are encouraged to seek guidance from your own financial or investment advisor.