Options Trading Metrics
Contents
There are four things that you need to specify when you want to buy or sell an option contract:
- The underlying asset
- The type of option: put option or call option
- The option expiration date, and sometimes time, because some expiration dates have settlement time at the open (AM expiration) and at the close (PM expiration).
- The strike price
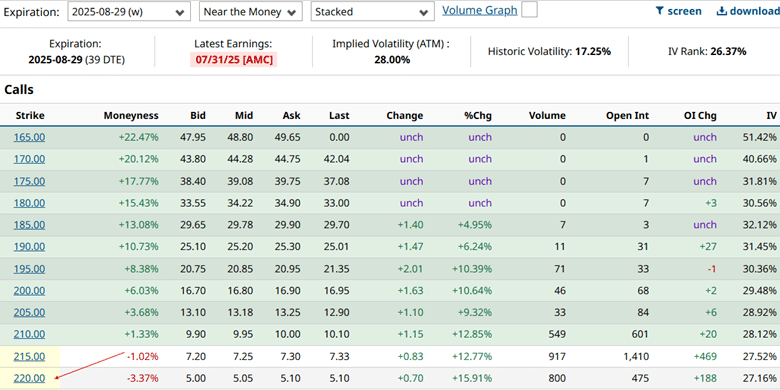
For example, the below option chain shows the call options (option type) for the Apple stock (the underlying) that is expiring on August 29, 2025 (expiration date).
In particular, I’m looking at the call option with the strike price of $220 (the one pointed to by the red arrow). And I’m looking at it on July 21, 2025.
Now that I have pinpointed the exact option contract of interest, I can see some option metrics with this particular contract.
Many platforms will give you these metrics.
But we will be using Barchart today, which you can see in the above screenshot.
Volume
Number of contracts traded today.
Open Interest (OI)
Total number of contracts currently open.
Bid Ask Spread
This is the difference between the price at which buyers are “bidding” to buy the option and the “asking” price that sellers would like to sell.
Therefore, the bid price is always less than the ask price because buyers want to buy low and sellers want to sell high.
The difference between these two prices tells us about the liquidity of the option.
The more liquid, the narrower the bid-ask spread.
The tighter the bid-ask spread, the lower the cost for entering and exiting the option contract, because one would lose less to “slippage” as the price of the option fluctuates between the bid and the ask price.
The mid-price is the price that is right in the middle between the bid price and the ask price.
Typically, when volume and open interest are higher, the bid-ask spread is tighter.
Implied Volatility (IV)
Implied volatility is the market’s forecast of future volatility based on option pricing.
The above screenshot shows that the 220-strike contract has an IV of 27.16%.
Since the IV doesn’t vary too much whether we go up or down a few strikes, Barchart also gives the general volatility metrics for the ATM (at-the-money) strikes for the August 29th expiration in the header as an Implied Volatility of generally 28%.
This volatility means that AAPL is expected to move 28% up or down annually.
IV Rank
Some stocks tend to move a lot (high volatility) and others less so.
Is an IV of 28% high or low for AAPL stock?
The IV Rank tells us where the current IV sits in relation to the past year’s range.
Right now, the IV Rank is showing 26.37%, which means that it is near the bottom quarter of its IV range.
Historical Volatility
Historical volatility is how much the stock moved on an annual basis, as opposed to IV, which is the projected movement.
Moneyness
This tells us whether this strike of our option contract is in-the-money, out-of-the-money, or at-the-money.
If the strike price is close to the current market price of the stock, then we say that the strike is at-the-money.
Since AAPL’s current price is $212, the $220 strike for the call option will be out-of-the-money.
A call option is out-of-the-money when its strike price is above the current stock price, because there is no value if we were to exercise the contract now.
This call option gives us the right to buy AAPL at $220.
No use buying at $220 when AAPL is trading at $212.
This call option has no intrinsic value right now.
But it does have extrinsic value, because someone is willing to buy the option at $5.05 per share.
Extrinsic value is the value of possibility – the possibility that it may become valuable in the future.
Some informally refer to extrinsic value as time value.
How far in or out of the money is moneyness? Barchart shows that this call contract has a moneyness of -3.37%.
Negative value means out-of-the-money.
The 200-strike would have a moneyness of 6%.
This strike is in the money because this call option enables us to buy AAPL at $200 per share, while it is trading at $212 per share.
It has an intrinsic value of $12 per share.
Keep in mind that we were only talking about call options.
Put options are different.
They are out-of-the-money when the strike price is below the current stock price.
Break-even price
If we had bought this call option at the mid-price of $5.05 per share, spending $505 to buy the contract (which represents 100 shares), then what price AAPL needs to be at expiration for us to be profitable buying this option?
AAPL needs to be at $225.05.
This is known as the break-even price.
Because if AAPL is at $225.05 at expiration on August 29, we can exercise the $220-strike option and buy AAPL at $220 per share, profiting $5.05 per share.
Since one contract allows us to do this for 100 shares, we gain $505 from the exercise, which is just enough to cover our initial cost of the call option. We break even.
Probability of profit
This is the probability that the option will be profitable at expiration.
What are the chances that AAPL will get to $225.05 at expiration?
That depends on how far out-of-the-money the option is right now.
It also depends on the IV of the stock (how much AAPL can move).
Other software programs may be able to calculate the probability of profit more accurately. But as a rough approximation, we can use Delta as a proxy.
Delta
It turns out that the Delta on the option chain will approximately tell you how likely it is for the option to get in the money.
For our call option to be profitable, the option needs to first get in-the-money, and then AAPL has to move further up to receive enough gains to also cover the initial cost of the option.
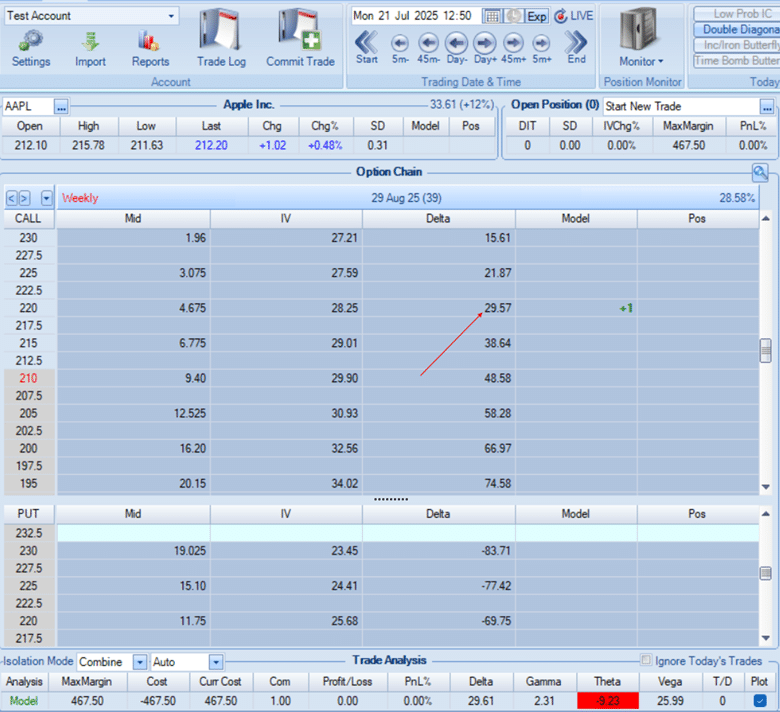
In OptionNet Explorer, we see that the call option has a delta of 29.57. We just say that it is at the 30-delta.
That means that there is a 30% chance that our call option will be in the money at expiration.
There is a 30% chance that AAPL can move up from $212 to $220 at expiration.
Then it needs to move up another $5.05 to cover the initial cost of the option.
In the OptionNet Explorer trade analysis panel at the bottom, we also see another Delta of 29.61.
For a single option, these two Deltas will be essentially the same.
Delta is a Greek that measures how much the price of an option is expected to change for a $1 move in the underlying.
This is its primary definition.
It tells the directionality of the option.
If its value is positive, then we want the underlying to move up in price so that the option value increases.
If its value is negative, then we want the underlying price (AAPL price) to move down to profit from the option.
The magnitude of the value of Delta tells us how directional the option is.
Theta
In the trade analysis panel, we also see that this call option has a theta of -9.23.
This means that the value of this option loses money as time passes, with all other things being equal.
If theta were positive, the option position would increase in value as it gets closer to expiration, with all other things being equal.
Vega
Vega is a Greek that tells how sensitive an option is to implied volatility.
If Vega is positive (as in this case of +25.99), the option will increase in value if IV increases.
If Vega is negative, the option position will lose value as IV increases – ceteris paribus.
Ceteris paribus is just a Geeky term used in economics to mean assuming all other factors stay the same so that we can isolate the effect of one variable.
Rho
Along with Delta, Theta, and Vega, Rho is the fourth option Greek (and is the least important). It tells how much the price of an option changes for a 1% change in the risk-free interest rate.
Gamma
There are also second-order option Greeks.
We need not worry about them, except perhaps for Gamma. Gamma measures how much the Delta of an option will change when the underlying stock price moves by $1.
The greater the magnitude of Gamma, the more Delta will change as the underlying asset price moves around.
In Conclusion
Suppose all this sounds like Greek to you. Don’t worry.
It can be confusing if this is the first time you have heard of all these terms.
And we have covered a lot of options metrics today.
Bookmark this page so that you can re-read it later, and eventually you will come to see how all the pieces are related.
We hope you enjoyed this article on options trading metrics.
If you have any questions, send an email or leave a comment below.
Trade safe!
Disclaimer: The information above is for educational purposes only and should not be treated as investment advice. The strategy presented would not be suitable for investors who are not familiar with exchange traded options. Any readers interested in this strategy should do their own research and seek advice from a licensed financial adviser.

Source link