Fundamental Analysis: Quality Screening With Piotroski F-Score
You’re looking for a way to figure out if a company’s fundamentals really justify its price. The Piotroski F-Score offers a framework for that. Joseph Piotroski, an accounting professor, created this nine-point checklist to evaluate profitability, leverage, and efficiency—basically, it helps you tell financially solid companies apart from those heading downhill.
You can use the F-Score to spot value stocks that aren’t just cheap, but actually have real financial strength.
When you apply these quality screens, you go beyond surface ratios and focus on the financial signals that actually matter. Each factor—such as better margins, lower debt, or positive cash flow—adds another piece of evidence that a company knows how to manage its resources.
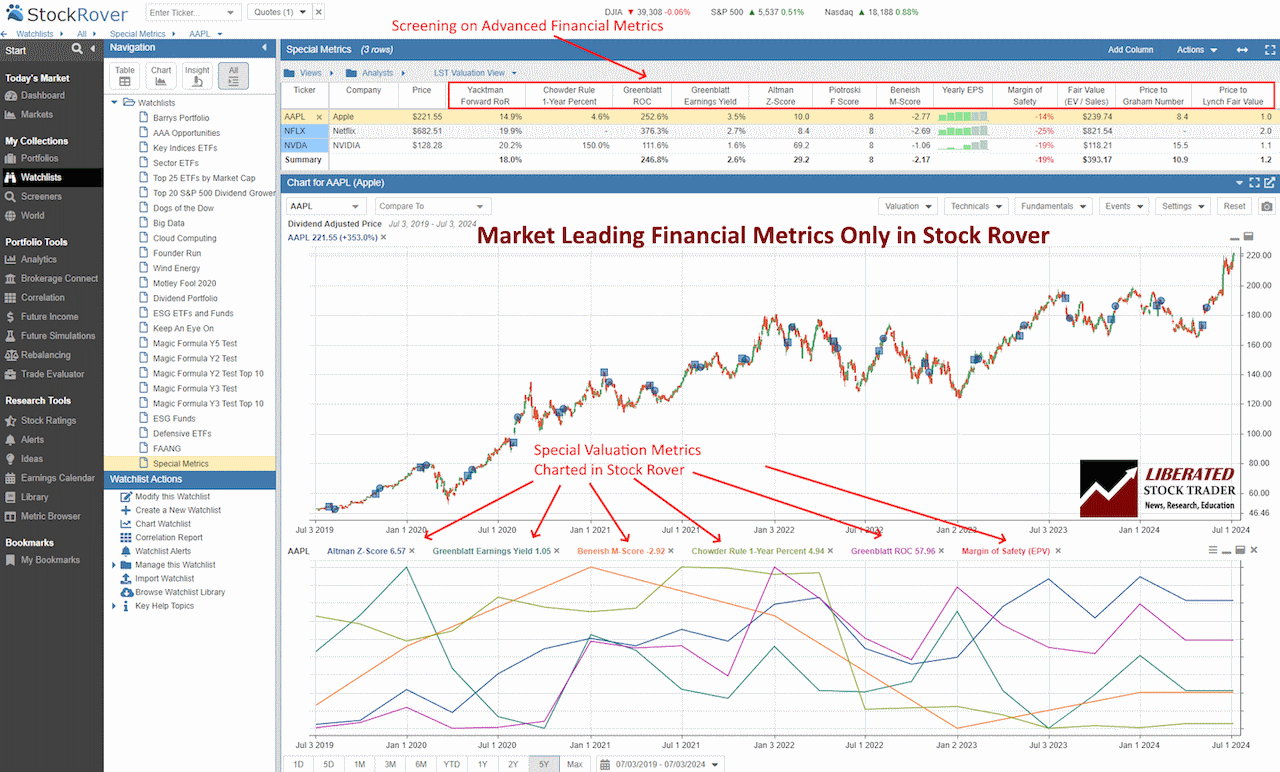
Tools like Stock Rover let you screen for these metrics and build watchlists that fit your standards.
You get a repeatable way to check any company’s financial health before you invest. The Piotroski F-Score isn’t magic, but it does give you a disciplined way to compare companies and boost your odds of finding long-term value.
Key Takeaways
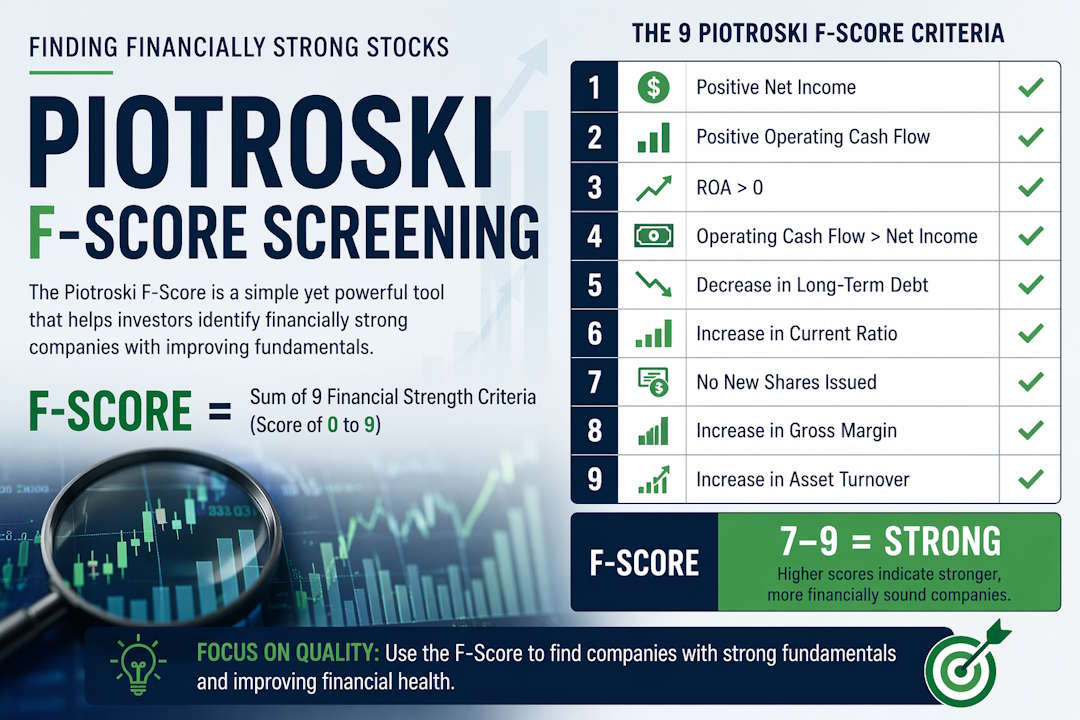
- The Piotroski F-Score checks a company’s financial strength using nine specific signals.
- Using the F-Score helps you identify undervalued stocks with solid fundamentals.
- Combining this score with other value strategies keeps your investment process more disciplined.
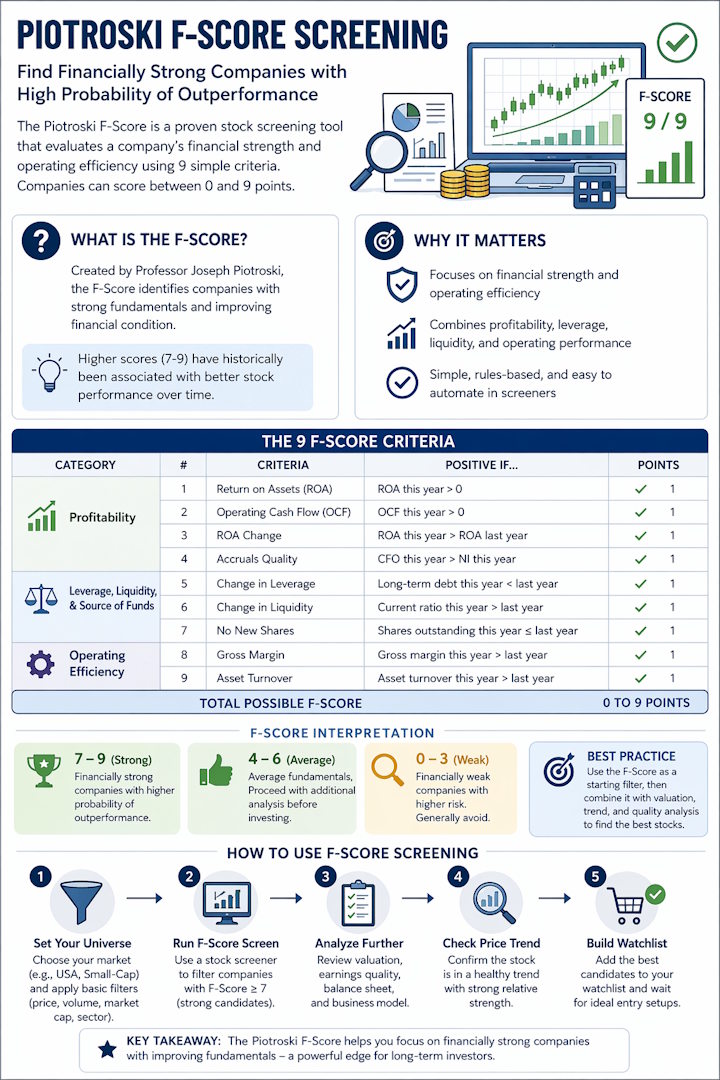
What Is the Piotroski F-Score?
The Piotroski F-Score checks a company’s financial strength using nine accounting-based criteria. It helps you spot firms with improving fundamentals and weed out those with shaky balance sheets.
Origin and Purpose
Joseph Piotroski introduced the F-Score in 2000 to make traditional value investing more effective. Back then, many cheap stocks in the U.S. stock market looked like bargains, but many were financially weak. Piotroski showed that a simple quality screen could separate value traps from real turnarounds.
The score runs from 0 to 9, based on nine yes-or-no signals from a company’s financial statements. Each positive signal gets one point—covering profitability, leverage, or operational efficiency. Higher scores mean better fundamentals.
| Score Range | Interpretation |
|---|---|
| 0–3 | Weak financial health |
| 4–6 | Average or mixed signals |
| 7–9 | Strong fundamentals |
The F-Score isn’t about predicting short-term price jumps. Instead, it’s about finding financially solid value stocks. You’ll get the most out of it when you combine it with other fundamental analysis tools or platforms like Stock Rover, which lets you backtest and compare companies using Piotroski’s approach.
Who Uses the F-Score
If you care about long-term value investing or fundamental research, the F-Score is for you. Institutional analysts, portfolio managers, and individual investors all use it to refine stock screens and double-check balance sheet strength before buying.
Quantitative funds often plug the F-Score into multi-factor models. It keeps them away from low-quality companies, even if the valuation looks tempting. Retail investors rely on it to see if a company’s fundamentals are actually getting better year after year.
This method fits best with deep value or contrarian strategies. You might combine it with data from Seeking Alpha or TradingView to compare financial trends and market sentiment. If you check the score annually and use it with other metrics, your analysis stays consistent and evidence-driven.
The Nine Quality Screens of the Piotroski F-Score
The Piotroski F-Score rates a company’s financial strength with nine accounting-based checks. These screens look at profitability, leverage, liquidity, and operating efficiency—helping you spot value stocks that are less likely to get into trouble.
Profitability Criteria
Profitability checks reveal if a company’s core business is actually creating value. There are four here: net income, return on assets (ROA), cash flow from operations (CFO), and earnings quality.
A company gets one point for positive net income and another for positive ROA, which shows profit relative to total assets. Consistently positive ROA means the company uses its assets well.
The CFO needs to be positive too, showing profits are backed by real cash. If CFO beats net income, you’ve got high-quality earnings—actual cash, not just accounting tricks. That helps you avoid companies reporting profits without the cash to back them up.
You can check these metrics quickly with Stock Rover, which provides multi-year ROA and cash flow charts to screen for profitable companies.
Leverage and Liquidity Criteria
These criteria look at a company’s financial stability and its ability to cover short-term bills. You’ll give a point if long-term debt declines year over year and the current ratio (current assets ÷ current liabilities) improves.
Lower leverage means less financial risk. A rising current ratio signals stronger liquidity—so the company can pay its bills without scrambling for new funding.
The F-Score also checks if the company issued new shares. If it didn’t, that’s another point, since it would fund operations internally rather than dilute shareholders.
Together, these measures indicate whether a company’s balance sheet is strengthening over time. You can track debt and liquidity trends with Seeking Alpha’s financials tab to quickly compare peers.
Operating Efficiency Criteria
Operating efficiency checks how well management turns resources into revenue. Two metrics count: gross margin and asset turnover ratio.
A company earns a point if gross margin improves, usually indicating better cost control or pricing power. Another point goes for a rising asset turnover ratio—more sales per asset dollar.
Better efficiency signals competitive strength and disciplined management. When both margins and turnover climb, the company is probably managing costs and assets smartly.
You can see these efficiency trends in TradingView charts that layer revenue and asset data together, making it easier to spot real improvements.
Applying the Piotroski F-Score in Practice
You can use the Piotroski F-Score to tell financially strong value stocks apart from weaker ones by checking profitability, leverage, and operational efficiency. The score’s structure makes it practical for screening undervalued stocks and spotting companies with improving financial health.
Stock Rover 4.7/5⭐ : My Top Pick for Smart Investors
Investing In Stocks Can Be Complicated. Stock Rover Makes It Easy.
★
Growth Investing – with industry-leading
Research Reports ★
★ Value Investing – using Warren Buffett’s Fair Value and Margin-of-Safety ★
★ Income Investing – rank by yield, growth, quality, and safety using 650 metrics ★

“I have been researching and investing in stocks for 20 years! I now manage all my long-term investments using Stock Rover.” — Barry D. Moore, Founder: LiberatedStockTrader.com
Step-by-Step Calculation
The Piotroski F-Score gives up to 9 points across three groups: profitability, leverage/liquidity, and operating efficiency. Each criterion gets a 1 if it passes and 0 if it does not.
| Category | Metric | Positive Condition (Score = 1) |
|---|---|---|
| Profitability | Net Income | Improved from the prior year |
| Profitability | Return on Assets (ROA) | Increased from the prior year |
| Profitability | Operating Cash Flow | Positive value |
| Leverage/Liquidity | Leverage Ratio | Declined year-over-year |
| Leverage/Liquidity | Current Ratio | Improved year-over-year |
| Leverage/Liquidity | Share Issuance | No new shares issued |
| Efficiency | Gross Margin | Increased from the prior year |
| Efficiency | Asset Turnover | Increased from prior year |
| Efficiency | Accruals | Operating cash flow > net income |
You can pull these numbers from financial statements or just use Stock Rover, which automates the screening. A score of 9 points to strong financial performance and stability; 0–3 usually means trouble.
Interpreting Scores
A company that scores 8–9 usually has solid financial health, steady profits, and improving efficiency. Scores in the 4–6 range mean average strength; you’ll want to dig into trends before making any moves. Scores of 0–3 are a red flag for financial weakness or slipping fundamentals.
High scores often appear in undervalued stocks that later outperform as their fundamentals improve. Low scores warn you about balance sheets that are getting worse or leverage that’s too high. Most investors use the score as a quality screen, not as a straight-up buy signal.
Pair the F-Score with valuation metrics like the price-to-book ratio or free cash flow yield to confirm if a stock is really undervalued. If the metrics don’t agree, it’s time for a closer look at management and the market.
Example: Real-World Application
Let’s say you’re comparing two regional banks trading below book value. Bank A scores 8 on the F-Score, while Bank B lands at 3. Bank A shows rising ROA, less leverage, and better margins—clear signs of improving strength. Bank B, on the other hand, has slipping liquidity and just issued new shares, which doesn’t inspire much confidence.
If you screen these banks in TradingView, you can add technical indicators such as price momentum or volume trends to see whether the market agrees. Combining both fundamental and technical evidence helps you dodge value traps.
Keep an eye on score changes each quarter. When a company’s F-Score keeps improving, that usually comes before better stock performance. If the score drops, it could mean financial stress or shrinking profits are on the way.
Integrating the F-Score with Value Investing Strategies
You can use the Piotroski F-Score to sharpen traditional value investing by focusing on companies with both low prices and strong fundamentals. When you apply it alongside valuation metrics, you spot firms that aren’t just cheap—they’re stable and getting better.
Screening for Value Stocks
The F-Score really shines when you first filter for value stocks—companies trading below what they’re probably worth. Start by screening for low price-to-book (P/B) ratios or high book-to-market ratios to flag undervaluation. Then, use the F-Score to weed out financially weak companies.
Each of the nine F-Score checks covers profitability, leverage, liquidity, and efficiency. Companies scoring 7–9 generally have improving fundamentals, while those below 3 might be in trouble.
If you use a research platform like Stock Rover, you can automate the process by combining quantitative filters—like return on assets, current ratio, and share issuance—with your favorite valuation metrics. This way, you focus on quality inside the value universe, not just companies that look cheap on paper.
Combining with Price-to-Book Ratio
The price-to-book ratio is a classic value metric, but it’s not foolproof. Sometimes low P/B stocks are real bargains, but other times they’re just in financial distress. The F-Score helps you tell which is which.
For example:
| P/B Range | F-Score Range | Interpretation |
|---|---|---|
| Low ( | High (7–9) | Undervalued and improving fundamentals |
| Low ( | Low (0–3) | Possible value trap |
| Moderate (1–2) | High (7–9) | Quality at a fair price |
This combo cuts down on false positives in your screens. You can test these filters in TradingView by backtesting portfolios across different markets to see if the F-Score actually boosts risk-adjusted returns.
Portfolio Construction
Once you’ve got your candidates, build a diversified portfolio that balances upside with risk. Give more weight to companies with high F-Scores and moderate valuation multiples. Don’t go overboard in one sector—the F-Score doesn’t account for industry quirks.
Rebalance once or twice a year using updated financial statements. Drop companies if their F-Scores fall off a cliff; that’s often a warning sign.
A practical setup might include 20–30 stocks with strong F-Scores, low debt, and positive cash flow trends. Use Seeking Alpha for deeper dives—check earnings revisions or insider moves that might support (or challenge) your thesis.
Comparing the Piotroski F-Score to Other Quality Screens
Every financial health screen looks at a company’s stability using its own set of accounting signals. Some focus on bankruptcy risk, while others dig into profitability or efficiency. If you want the full picture, try layering them together—you’ll see whether a company’s fundamentals line up across several angles.
Altman Z-Score
The Altman Z-Score estimates bankruptcy risk by combining five weighted ratios from the balance sheet and income statement. It pulls in working capital and retained earnings as a percentage of total assets, then spits out a single score.
A value above 3.0 means strong financial health. If it’s under 1.8, that’s a warning sign.
The Piotroski F-Score rewards improving fundamentals, but the Z-Score merely checks solvency at a single point in time. The Z-Score fits best for manufacturers and companies with steady, tangible assets. Service and tech firms—especially those with lots of intangibles—often don’t fit the model well.
You can compare Z-Scores and F-Scores side by side on Stock Rover. The platform aligns ratios and shows historical trends, making it much easier to spot companies that are both financially sound and on an upswing. That’s a big deal if you’re sorting through value or growth stocks.
Other Financial Health Metrics
Beyond Piotroski and Altman, you’ve got plenty of other tools. Return on equity (ROE) and debt-to-equity ratios track how efficiently a company uses capital. Current ratio and interest coverage highlight liquidity and debt service.
Many investors check these alongside the F-Score. For example, if a company scores highly on the F-Score but low on ROE, it might be improving but not yet running efficiently. If it’s the other way around, strong ROE and a weak F-Score could mean earnings are up, but the balance sheet isn’t backing it.
Platforms like Seeking Alpha let you cross-check these numbers across sectors and over time. Using several metrics together keeps you from leaning too hard on just one model and gives you a sharper look at long-term strength.
Limits and Practical Considerations
The Piotroski F-Score helps you spot financially strong companies, but you’ll get the most out of it if you know where it falls short. Industry differences, shifts in the economic cycle, and plain old data errors can all mess with how useful the score ends up being.
Sector and Industry Differences
The F-Score assumes accounting ratios mean the same thing everywhere, but that’s rarely true. Asset-heavy industries like manufacturing and energy exhibit leverage and margin patterns that look nothing like those in software or healthcare. If you compare them directly, you’ll get misleading results.
Always adjust your expectations by sector. A score of 7 in utilities usually means strong fundamentals, but in tech, it might be just average. Use peer benchmarks instead of strict cutoffs.
A lot of folks filter by sector and compare companies within the same group. That way, your analysis actually matches how those businesses run.
| Sector Type | Typical Leverage | Common Distortion |
|---|---|---|
| Industrial | High | Capital intensity |
| Technology | Low | Intangible assets |
| Financial | Variable | Regulatory capital |
Double-check that you’re comparing similar accounting structures and business models before you start ranking by F-Score.
Economic Cycle Effects
The F-Score tracks year-over-year gains in profitability, leverage, and liquidity. But when recessions or slowdowns hit, even solid companies can show temporary dips. That makes the signal weaker and could steer you away from good stocks.
During early recovery, you’ll often see companies post high scores because of cyclical rebounds, not necessarily lasting improvements.
Overlay macro charts like GDP growth or sector ETFs on TradingView to get some context. That helps you figure out if a score bump means real improvement or just a short-term bounce.
Shift your screening thresholds as the cycle turns. Staying flexible usually leads to better accuracy and fewer false positives.
Common Pitfalls
Some users treat the F-Score like a checklist and skip checking the data. Restated statements, odd fiscal years, or missing info can throw off the calculation. Always double-check your sources before ranking.
The F-Score measures financial health, not market momentum. If you combine it with trend analysis from TrendSpider or similar tools, you’ll have a better shot at timing your trades.
Be extra cautious with micro-cap or foreign stocks—disclosure standards aren’t always consistent, and the F-Score might miss key risks.
Keep a checklist handy: verify your data, make sure you’re comparing similar sectors, and always consider the economic environment before you act on any score.
FAQs
What indicates a strong Piotroski F-Score for a company?
A score of 8 or 9 means the company’s in great financial shape. 0 to 2 usually signals weakness.
Investors often target high scores when looking for undervalued stocks, since those firms tend to show better profitability and conservative balance sheets.
Can the Piotroski F-Score predict stock performance?
The F-Score doesn’t predict future prices, but it does highlight firms with improving fundamentals. Studies show high-scoring value stocks often outperform low-scoring stocks over time, but results can swing depending on the market and period.
Treat it as a supporting factor—not a crystal ball. Pair it with valuation metrics or trend analysis to strengthen your case.
What are the limitations of using the Piotroski F-Score in stock analysis?
The model only looks at historical financial data, so it might miss recent events. It fits best for value stocks and doesn’t always catch growth momentum or sector-specific quirks.
Try pairing it with forward-looking indicators or qualitative checks, such as management quality or market position.
Are there any free tools available for screening stocks with a high Piotroski F-Score?
Absolutely. You’ll find that several stock screeners let you filter by the Piotroski F-Score. Stock Rover provides free access to this feature.
You can jump in, sort companies by their F-Score, tack on extra filters, and even export your lists to compare or dig deeper.
Source link