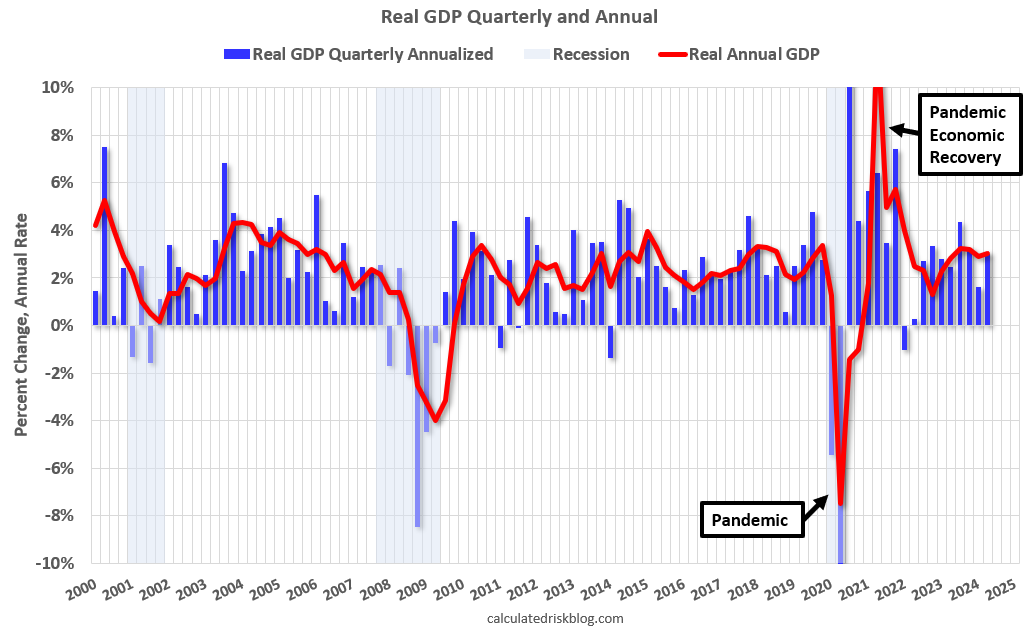
Real GDP Annual and Quarterly
by Calculated Risk on 10/16/2024 02:49:00 PM
The following graph shows real GDP quarterly (blue, annualized), and the year-over-year change in GDP (red).
 Click on graph for larger image.
The pandemic slump and subsequent economic recovery are cutoff and marked.