Render Price Plunges 3% As Bears Dominate Market: What Next for RNDR?


Render price has experienced a significant downturn, declining over 15% in the past month. Despite this recent drop, the cryptocurrency remains up by over 235% year-to-date. Currently, RENDER is stuck in a bearish trend. This pattern is evident as the altcoin has consistently hit lower and lower highs over the past few days.
Over the past day, Render (RNDR) experienced price fluctuations, with a low of $5.78 and a high of $6.19. Despite this, Render remains significantly up from its all-time low of $0.03676 on June 16, 2020, showing a substantial long-term increase. However, it is still down by 55.78% from its all-time high of $13.60 on March 17, 2024.
Render Price Forecast: Will Recent Decline Continue or Rebound Soon?
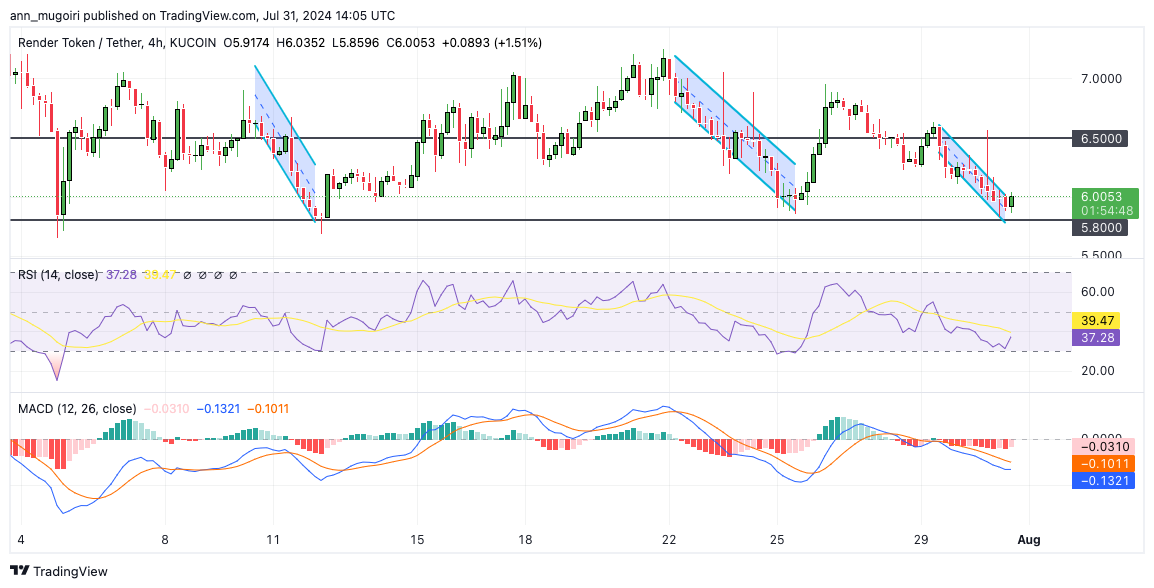
Render price has been declining recently following the market correction. As of the time of writing, RENDER price is trading at $6.02 during the 24 hours, dipping 3% during U.S. trading hours. The AI-based altcoin has been hovering around $5.90, with fluctuations indicating a volatile market sentiment.
Render has maintained a consistent price range since the beginning of July. Despite the broader market’s upward trajectory, Render experienced a notable decline in demand last week. This drop in demand has raised concerns that Render’s price may soon dip below its established support levels.
Can Bulls Break Resistance and Reverse the Trend?
The support level for Render is currently at $5.8. If bears mount pressure and the support at $5.80 breaks down, the price could potentially fall to $5.50 or even $5.30, indicating a bearish trend and possible further declines.
The 4-hour technical indicator for RNDR shows a bearish signal. The Relative Strength Index (RSI) is at 37, indicating that the asset is nearly oversold. If the trend reverses upwards from this level, this suggests a potential buying opportunity. The 20-Exponential Moving Average is positioned below the 50-EMA, indicating the momentum favoring sellers.
The Moving Average Convergence Divergence (MACD) indicates a bearish trend, with the MACD line moving below the signal line at -0.1386. However, the histogram slightly increases, suggesting that the bearish momentum may weaken.
Render price is facing a strong rejection at $6.1. If bulls make a return and push the price past $6.5 and, subsequently $7, it could signify a bullish breakout.
Frequently Asked Questions (FAQs)
RNDR is a decentralized GPU rendering network on the Ethereum blockchain.
RNDR launched publicly on April 27, 2020.
During the private sale, RNDR tokens were priced at $0.25 each.
Related Articles
Coingape Staff
CoinGape comprises an experienced team of native content writers and editors working round the clock to cover news globally and present news as a fact rather than an opinion. CoinGape writers and reporters contributed to this article.
Disclaimer: The presented content may include the personal opinion of the author and is subject to market condition. Do your market research before investing in cryptocurrencies. The author or the publication does not hold any responsibility for your personal financial loss.
Source link


✓ Share: