Finding Durable Compounding Growth Stocks with ROIC
If you want real growth investments, you need to focus on businesses that actually compound value year after year—not just the ones promising big returns. You’re looking for companies that know how to reinvest profits at strong rates and hang onto their competitive edge.
A true compounder delivers sustainable growth by combining a durable moat, high return on invested capital (ROIC), and steady reinvestment opportunities.
You’ll spot these businesses by seeing how well they turn capital into profits and how much of those profits they can plow back in at similar returns. A strong moat—maybe brand strength, cost advantage, or switching costs—keeps those returns safe from competitors.
Tools like Stock Rover help you screen for companies with consistently high ROIC and disciplined reinvestment habits.
When you find a business earning superior returns and compounding without dilution or waste, you’ve found something rare. These are the companies that turn time into value, not just size.
Key Takeaways
- Compounders grow by blending a durable moat, high ROIC, and steady reinvestment.
- Measuring ROIC and reinvestment rate shows the quality and staying power of growth.
- Screening tools help you spot businesses that turn capital efficiency into lasting value.
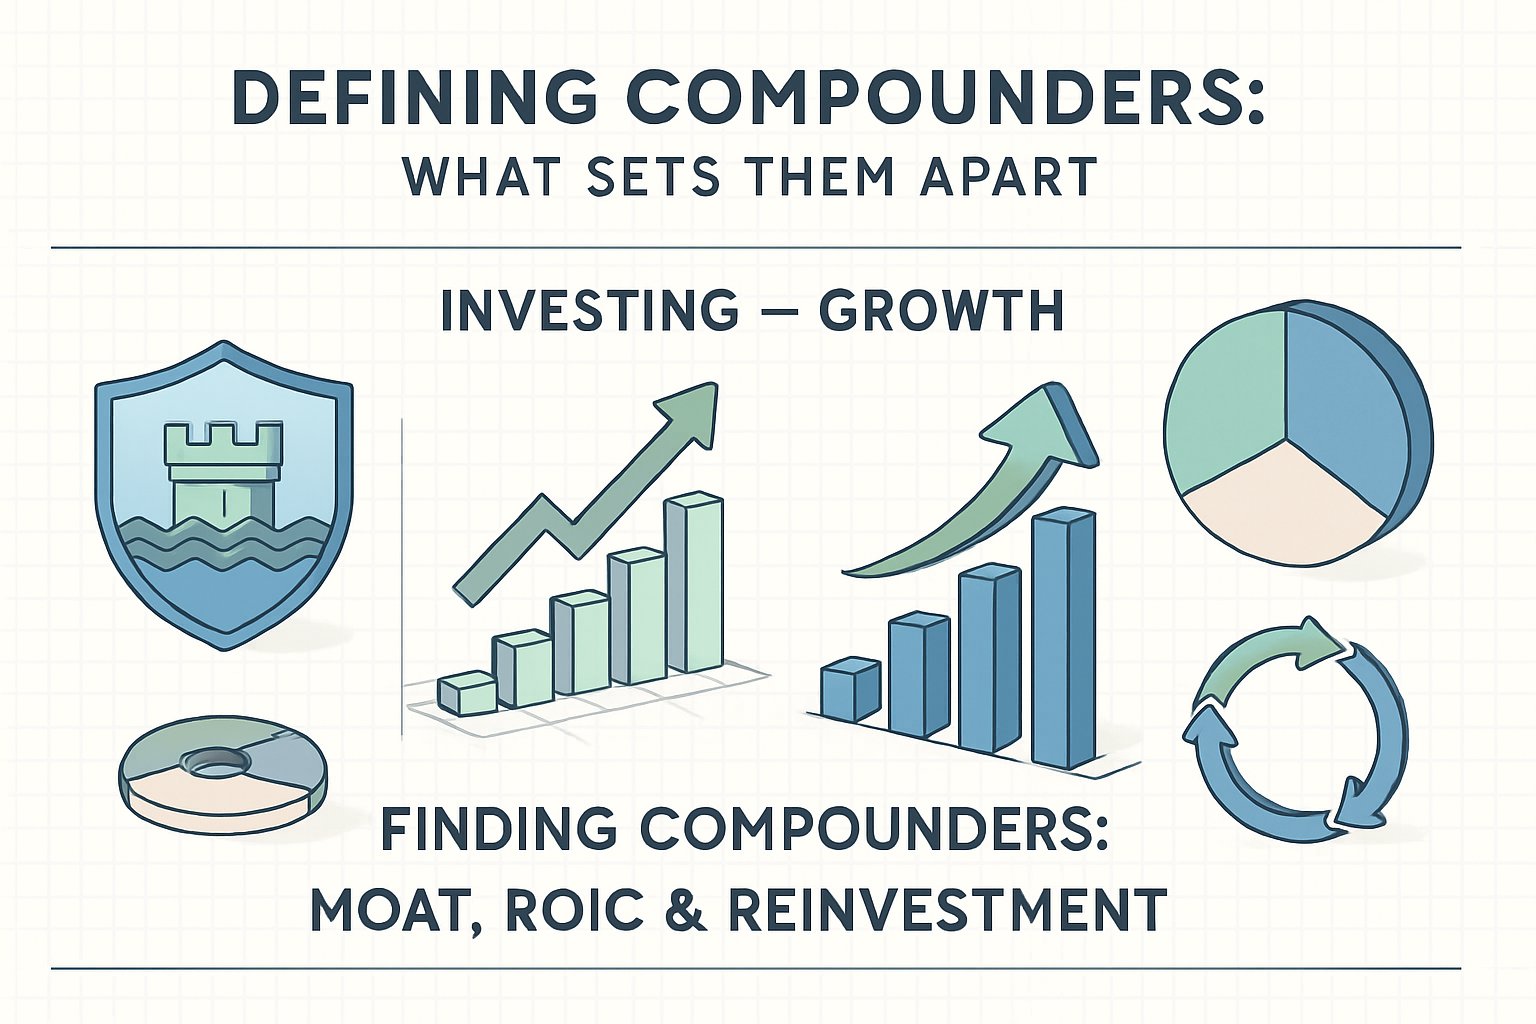
Defining Compounders: What Sets Them Apart
Compounders generate durable growth by earning high returns on invested capital and efficiently reinvesting those returns. They expand intrinsic value over time through disciplined capital allocation and consistent reinvestment—not just short-term market pops.
Characteristics of Compounders
A compounder keeps high returns on invested capital (ROIC) and a competitive moat that protects profits. That moat might be brand strength, cost leadership, network effects, or switching costs. Each one fends off competition and preserves pricing power.
Strong cash flow generation supports reinvestment and shareholder returns. Low capital intensity means more free cash for growth or buybacks. Many compounders also carry low leverage, so their balance sheets stay flexible in downturns.
| Key Trait | Why It Matters |
|---|---|
| High ROIC | Indicates efficient use of capital |
| Durable Moat | Protects margins and market share |
| Strong Cash Flow | Funds reinvestment and dividends |
| Low Leverage | Reduces financial risk |
You can use Stock Rover to screen for companies with above-average ROIC and consistent free cash flow growth. Focus on those reinvesting earnings at high incremental returns rather than paying everything out.
Why Consistency Matters in Growth
Compounding only works if growth keeps going. A one-off earnings spike doesn’t mean much if returns revert to the average. The best compounders deliver steady, repeatable growth across cycles.
Consistency usually signals management discipline and a clear business model. Firms that maintain stable margins and reinvestment rates during recessions tend to outperform over the long term.
You should track five-year ROIC trends and earnings volatility. Stable numbers suggest a resilient business. Platforms like Seeking Alpha let you compare long-term performance and management commentary to check for durability before investing.
Role of Capital Allocation in Compounding
Even strong businesses can blow it with lousy capital allocation. Leaders of real compounders put cash where it earns the best risk-adjusted return—whether that’s reinvesting in the core, buying complementary assets, or returning capital via buybacks or dividends.
Effective capital allocation balances growth, investment, and shareholder returns. If a company earns 20% ROIC but reinvests only at 10%, the value will slip over time. The goal is to keep incremental returns above the cost of capital.
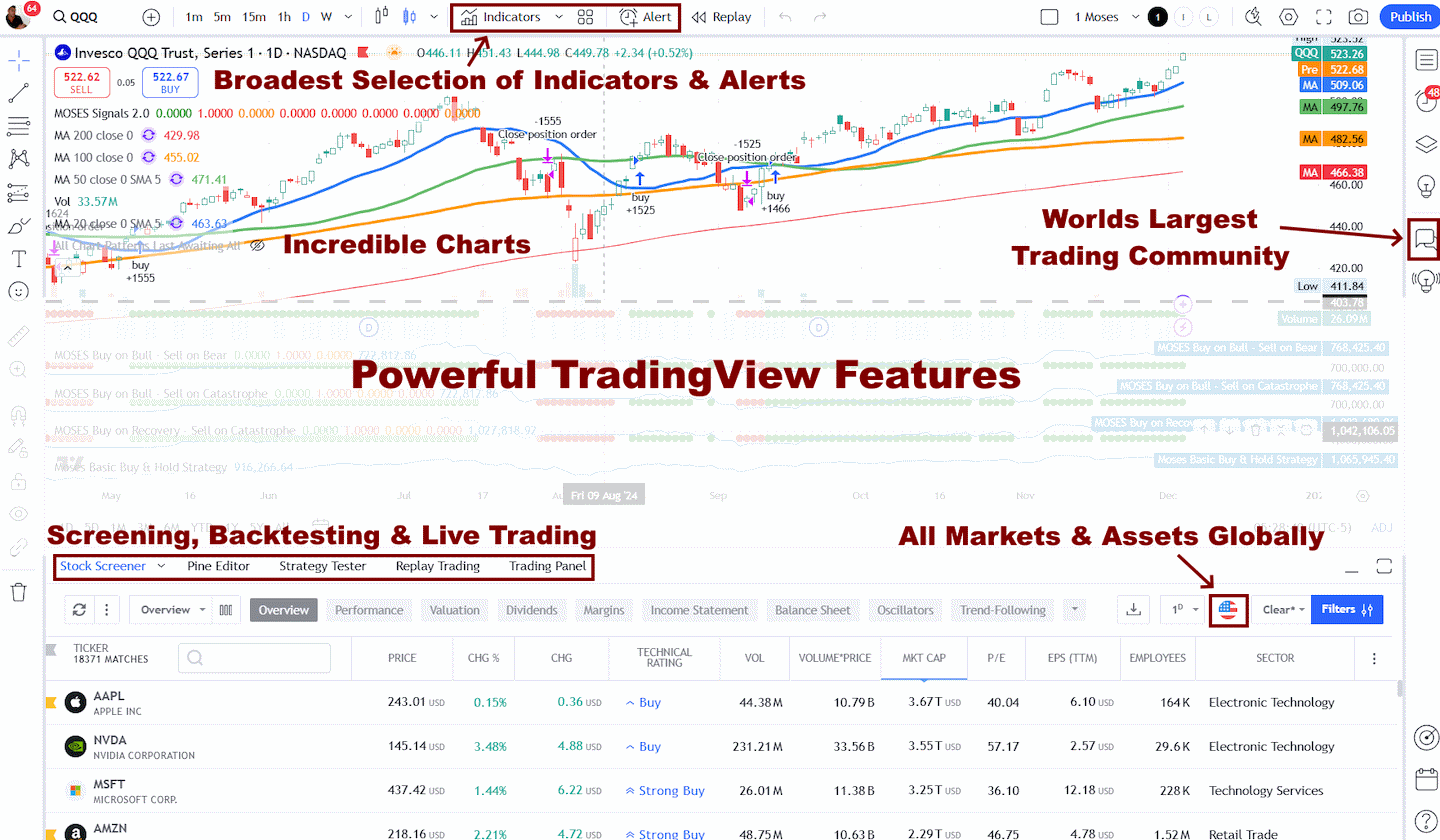
You can analyze this with TradingView by tracking total shareholder return and reinvestment efficiency over time. Look for firms that reinvest wisely, avoid overpaying for acquisitions, and stay flexible as opportunities shift.
My thorough testing awarded TradingView a stellar 4.8 stars!
With powerful stock chart analysis, pattern recognition, screening, backtesting, and a 20+ million user community, it’s a game-changer for traders.
Whether you’re trading in the US or internationally, TradingView is my top pick for its unmatched features and ease of use.
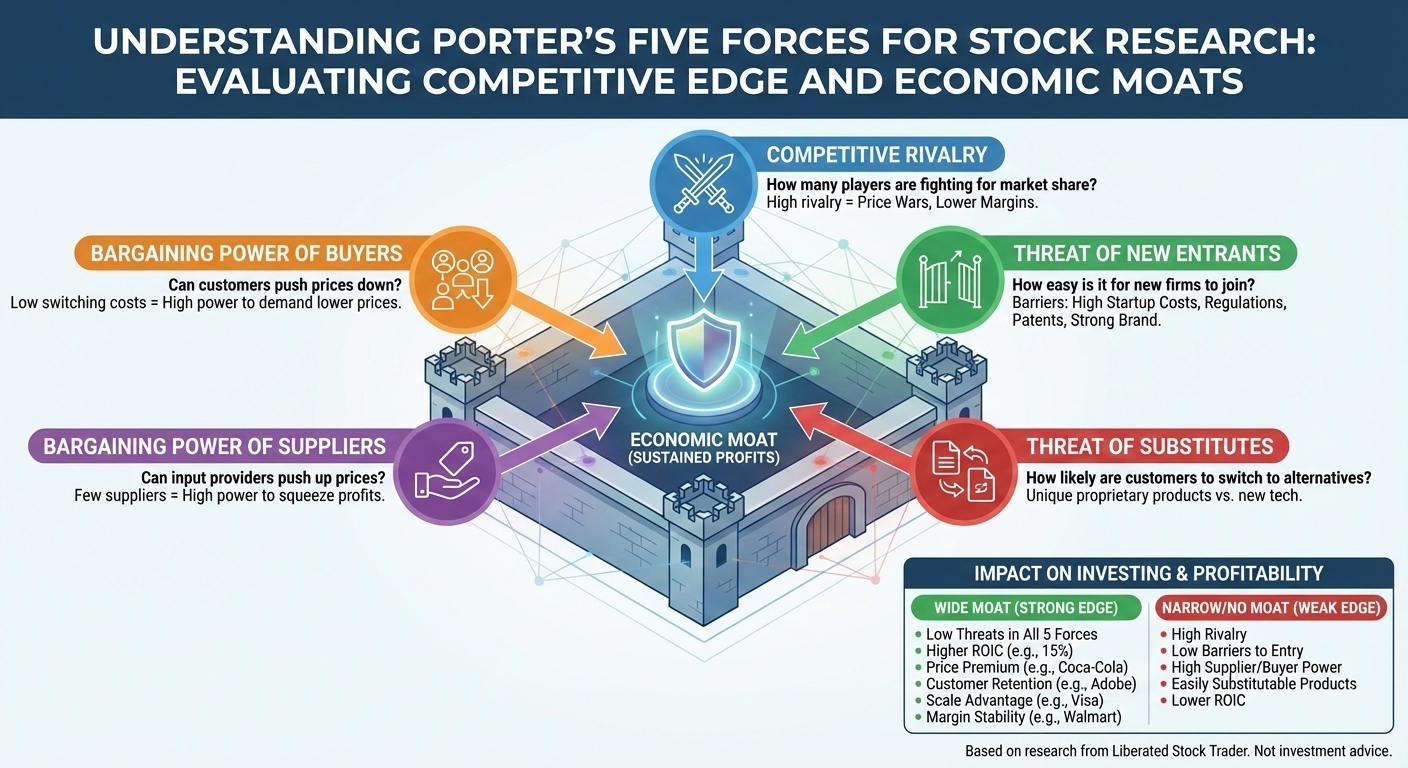
Understanding Moats and Competitive Advantage
A company’s moat shows how well it protects its profits from competitors. You evaluate it by looking at pricing power, cost efficiency, and customer loyalty that actually last. Strong moats usually lead to higher returns on invested capital (ROIC) and the ability to reinvest at good rates.
Types of Moats
You can break moats into several types: cost advantage, switching costs, network effect, intangible assets, and efficient scale. Each one protects a company’s margins in its own way.
A cost advantage lets a business produce goods or services at a lower cost than competitors, sometimes thanks to proprietary processes or sheer scale. Switching costs keep customers locked in when changing providers is expensive or just a pain, like with enterprise software.
Efficient scale pops up in markets where there’s only room for a few players—think regional utilities. Companies with high ROIC and stable market share usually show at least one of these traits.
Network Effect and Intangible Assets
A network effect occurs when each new user makes the product more valuable to everyone else. Payment networks, social platforms, and marketplaces all use this. Once it’s in place, it’s tough for newcomers to break in.
Intangible assets—such as patents, brands, and proprietary data—also create strong barriers to entry. They let companies charge premium prices or keep customer trust. For example, a patented drug or a trusted brand like Visa benefits from both legal and psychological protection.
Sustaining a Competitive Edge
Moats can erode if technology, regulation, or consumer habits shift faster than a company adapts. You keep an edge by reinvesting profits into innovation, customer service, and process improvements.
Track reinvestment rate with ROIC to see if a company compounds value effectively. High returns don’t mean much if capital isn’t getting redeployed into projects that keep the moat strong.
Check yourself:
- Is the advantage structural or just temporary?
- Does management allocate capital wisely?
- Are competitors closing the gap?
Watching these signals helps you decide when to hold on or move on. Tools like Seeking Alpha provide peer comparisons and management commentary to confirm whether a firm’s edge is still real.
ROIC: Measuring Quality and Value Creation
You judge a company’s quality by how well it turns capital into profit and how long it can keep that up. Strong returns on invested capital (ROIC) paired with disciplined reinvestment signal durable value creation and a moat against competitors.
Return on Invested Capital Explained
ROIC shows how well a company turns its invested capital into after-tax operating profit. It reflects both operational efficiency and capital allocation discipline. If a company keeps ROIC high—especially above its industry average—it probably has pricing power, cost advantages, or intangibles that competitors can’t just copy.
You find ROIC by dividing Net Operating Profit After Tax (NOPAT) by Invested Capital. NOPAT equals EBIT × (1 – tax rate), so you’re focusing on core operations, not financing. Invested capital covers equity and interest-bearing debt minus non-operating assets.
Analysts use ROIC to see if growth adds or destroys value. Aswath Damodaran points out that growth only creates value when new investments earn returns above their cost of capital.
Calculating ROIC: Key Components
You start with accurate NOPAT. You get NOPAT from operating profit (EBIT), adjust for taxes, and ignore interest. That way, you’re isolating performance from financing.
Define invested capital precisely. Include net working capital, fixed assets, and capitalized intangibles, subtract excess cash, and don’t overstate by including non-operating items. Here’s the basic breakdown:
| Component | Description | Example |
|---|---|---|
| EBIT | Operating profit before interest | $500M |
| Tax Rate | Effective tax rate | 25% |
| NOPAT | EBIT × (1 – tax rate) | $375M |
| Invested Capital | Debt + Equity – Non-operating Assets | $3B |
| ROIC | NOPAT ÷ Invested Capital | 12.5% |
You should track ROIC over several years to see if it holds up. A rising ROIC usually indicates better asset turnover or higher margins, while a decline can signal capital inefficiency.
ROIC vs. Cost of Capital
To see if a company’s really creating value, compare ROIC to the Weighted Average Cost of Capital (WACC). The spread between the two is the company’s economic profit. When ROIC beats WACC, each dollar invested generates more than it costs, which is what you want.
If ROIC drops below WACC, growth actually destroys value—even if revenue is rising. This helps you avoid “growth traps” where expansion hides lousy returns. Sometimes, mature firms with modest growth but high ROIC perform better than fast growers reinvesting at low returns.
You estimate the WACC as the weighted average of the firm’s cost of equity and after-tax cost of debt, based on the firm’s capital structure. Watching the ROIC–WACC spread over time helps you spot sustainable compounders.
Reinvestment Rate: The Engine of Sustainable Growth
Sustainable growth depends on how much profit a company reinvests and how efficiently it reinvests it. You judge both by looking at the reinvestment rate, the quality of capital allocation, and how net capital spending and working capital needs line up.
Defining and Calculating Reinvestment Rate
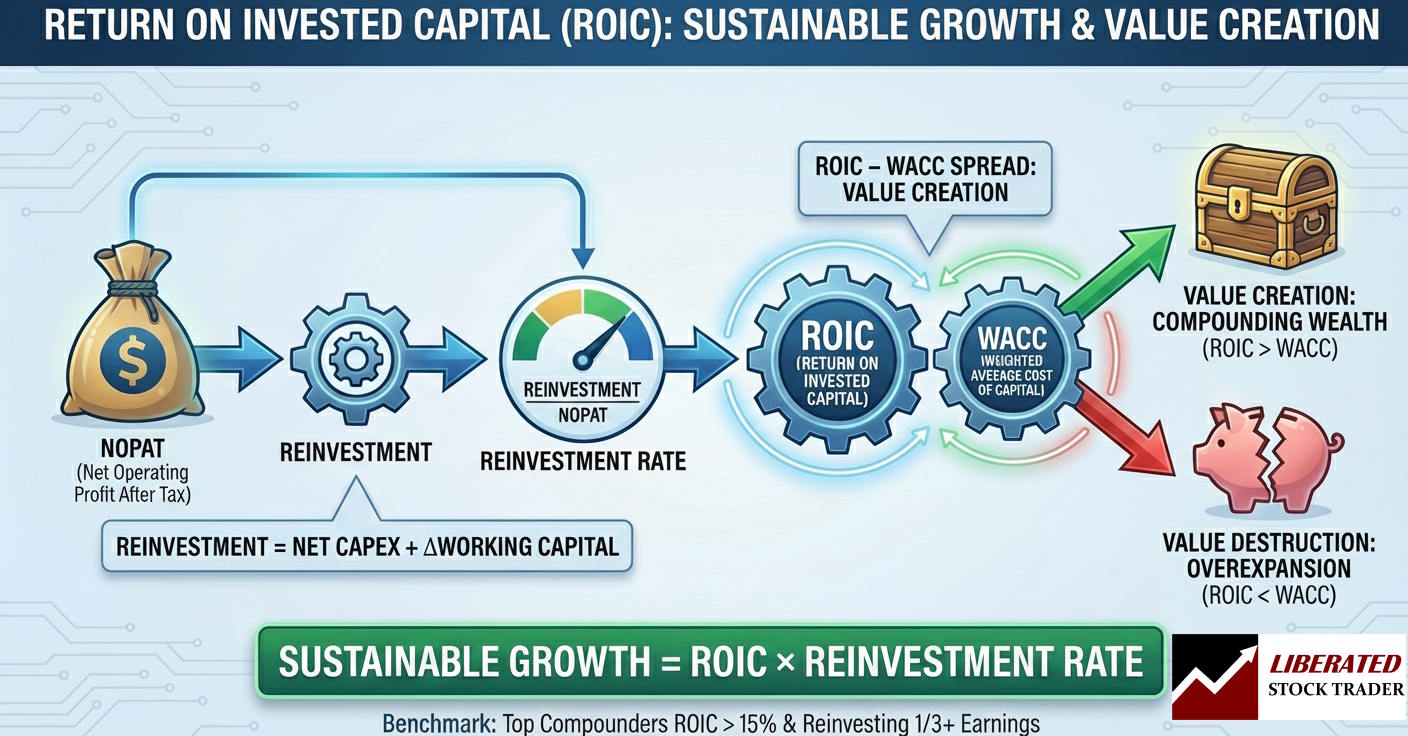
The reinvestment rate tells you how much of a company’s after-tax operating profit (NOPAT) gets put back into the business. It connects straight to growth with this equation:
Sustainable Growth = ROIC × Reinvestment Rate
You calculate it as:
| Formula | Description |
|---|---|
| Reinvestment Rate = Reinvestment / NOPAT | Reinvestment includes net capital expenditures and changes in working capital. |
A high reinvestment rate means management is betting more cash on expansion. But that only pays off if return on invested capital (ROIC) is higher than the weighted average cost of capital (WACC). Otherwise, reinvestment just waters down returns.
When you’re screening for solid compounders, compare reinvestment rates across peers over several years. Look for steady numbers and alignment with ROIC trends.
Net Capex and Working Capital
Net capital expenditures (Capex – Depreciation) show what a company spends to keep things running and to grow. Maintenance Capex keeps existing assets productive; growth Capex boosts capacity.
Working capital—current assets minus current liabilities—shows cash tied up in inventory, receivables, and payables. If working capital rises, it uses cash; if it drops, it frees up cash.
Together, these two pieces make up the cash reinvested each year:
Reinvestment = Net Capex + ΔWorking Capital
Efficient companies keep a lid on unnecessary working capital growth and push more cash into productive CapEx. You want steady reinvestment that supports sales growth without straining liquidity.
Reinvestment Opportunities and Limits
Not every company offers the same reinvestment potential. Mature businesses with few expansion opportunities usually return cash to shareholders through dividends or buybacks. Growth firms, on the other hand, tend to reinvest when they spot high-return opportunities.
You’ll want to assess reinvestment opportunities by digging into market saturation, pricing power, and scalability. Even a high-ROIC company can hit a wall if it runs out of efficient capital deployment opportunities.
Check out Seeking Alpha or similar platforms to see how management actually allocates capital and what reinvestment patterns look like in the industry. Try to find evidence of disciplined reinvestment, not just spending for the sake of growth.
The mix of reinvestment rate and return really shapes how quickly and sustainably a business can compound its capital.
Connecting ROIC, Reinvestment, and Earnings Growth
Earnings growth comes down to how well a company turns invested capital into profits and how much of those profits get reinvested. You can estimate sustainable growth by connecting return on invested capital (ROIC) with the reinvestment rate—together, they show how internal cash generation powers long-term value.
Growth Formula in Practice
Here’s the core relationship:
Earnings Growth = ROIC × Reinvestment Rate
ROIC tells you how effectively a company turns operating income into returns on its invested capital. The reinvestment rate is the share of after-tax operating profits reinvested in new projects or assets. When both stay high, earnings and free cash flow can snowball.
Say a business posts 15% ROIC and reinvests 40% of profits—it should grow operating income around 6% per year. You can check these numbers with Stock Rover, which breaks down reinvestment ratios and ROIC by segment or timeframe.
But here’s the catch: high growth from reinvestment only creates value if incremental ROIC beats the cost of capital. Otherwise, new investment just drags down returns, even if sales climb.
Value Creation Versus Value Destruction
A company creates value when its ROIC exceeds its weighted average cost of capital (WACC). If ROIC drops below WACC, every dollar reinvested chips away at shareholder value. Think of it as the difference between compounding wealth and just spinning your wheels.
Firms with real moats—cost advantages, pricing power, or both—tend to keep ROIC well above capital costs. They can reinvest earnings without hurting margins or cash flow. Businesses with weak competitive positions often chase growth that burns cash and drags down returns.
Watch operating profits, cash conversion, and incremental ROIC to judge if reinvestment genuinely adds value. A rising ROIC trend usually signals smart capital use; a falling one? That’s often a warning about overexpansion.
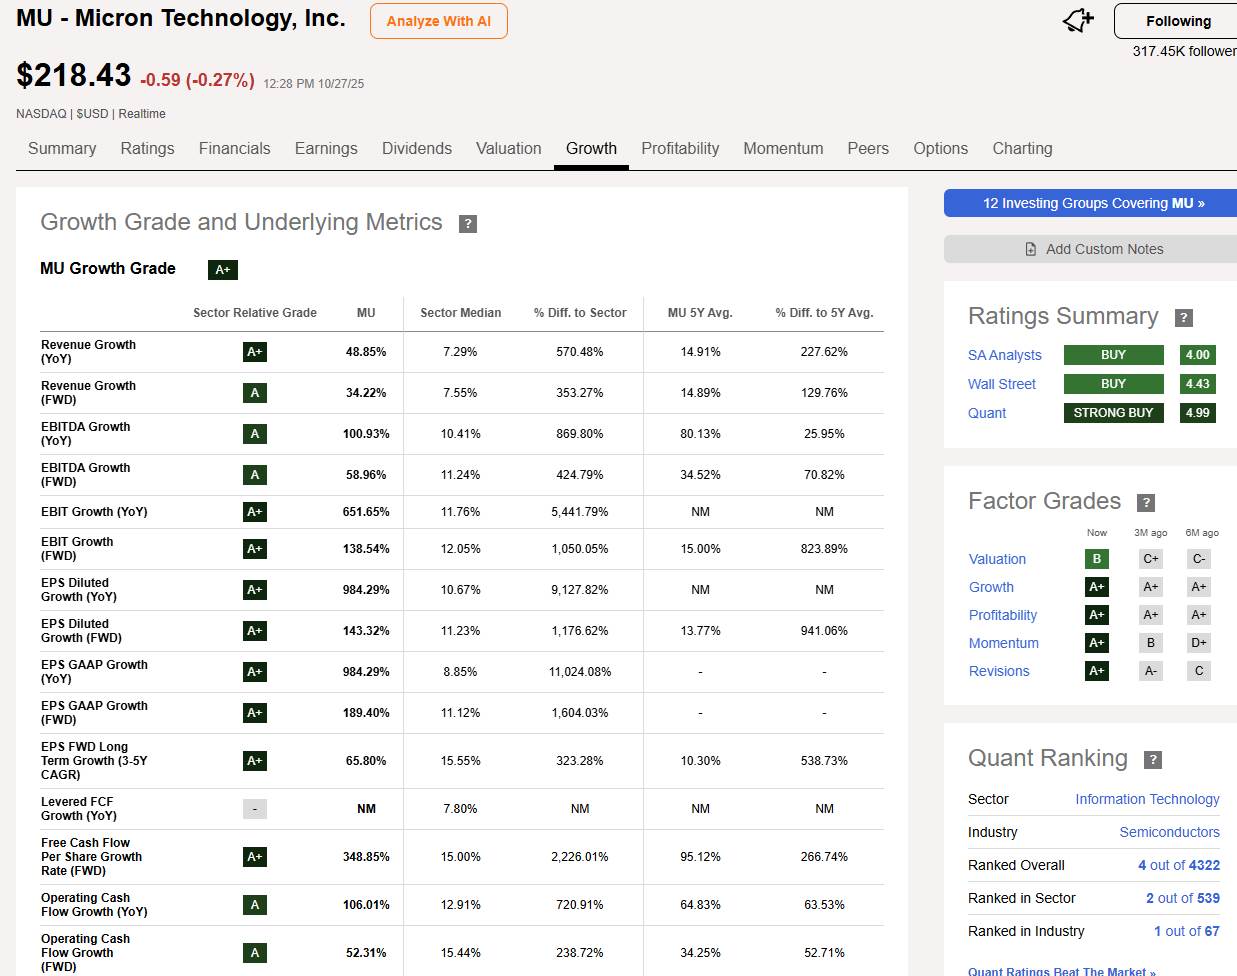
Benchmarks and Real-World Examples
Top compounders usually land ROIC above 15% and reinvest at least a third of their earnings. Mature companies with fewer reinvestment options might return cash through dividends or buybacks rather than pursuing mediocre projects.
Think of global consumer brands or software providers—they often keep high ROIC thanks to scalable assets and recurring revenue streams.
When you’re comparing companies, don’t get distracted by single-year spikes. Multi-year averages of ROIC and steady reinvestment usually reveal whether a business can really grow earnings and free cash flow over time.
Capital Allocation Beyond Reinvestment
Capital allocation isn’t just about plowing money back into the core business. You also have to decide how to return excess cash to shareholders, when to acquire other companies, and how much debt to carry, balancing stability and growth. Every one of these choices hits intrinsic value, ROIC, and your long-term compounding potential.
Dividends and Share Buybacks
Dividends and buybacks come into play when internal reinvestment options become less attractive. Dividends provide a steady stream of income and appeal to yield-focused investors. Buybacks shrink the share count, which boosts earnings per share and increases your ownership slice if you hold on.
Compare the dividend yield and buyback yield to gauge total shareholder return. For example, a 2% dividend plus a 3% buyback yield means the company returns about 5% of its market value to shareholders each year.
Buybacks only add value if shares trade below fair value—measured by intrinsic value or long-term ROIC. If companies repurchase at inflated prices, they’re just burning cash. Tools like Stock Rover let you filter for firms with consistent free cash flow covering dividends and buybacks.
When evaluating payout policies, consider the payout ratio and free cash flow conversion. Healthy programs usually keep payout ratios under 60% of normalized free cash flow.
Acquisitions and Goodwill
Acquisitions can speed up growth, but they also risk diluting ROIC if management overpays. The amount paid above net identifiable assets is recorded as goodwill on the balance sheet and must earn its keep through future cash flows.
Track ROIC before and after acquisitions. If ROIC drops after a deal, you might be seeing integration headaches or pricing mistakes. The best acquirers go after bolt-on deals that expand reach or tech without piling up goodwill.
If goodwill makes up more than 40% of total assets, take a closer look. That usually means management paid up for deals that might not deliver. Regular impairment tests can show whether management’s optimism actually pans out.
Managing Net Debt and Financial Flexibility
Managing net debt—total debt minus cash—shapes how much breathing room a company has in tough times. Low leverage lets you reinvest and buy back shares opportunistically, while high leverage can juice returns but also raises the stakes.
Check net debt-to-EBITDA and interest coverage ratios. Numbers like net debt/EBITDA below 2× and coverage above 6× usually mean a solid balance sheet.
Companies with high ROIC and reasonable leverage can borrow at good rates to fund growth or buybacks. But if rates rise or earnings get choppy, those fixed payments can become a real headache.
Keep a cushion of cash and unused credit lines to handle surprises.
Source link