Royal Caribbean’s INSANE Growth—Is This the Best Investment in Travel Right Now?

Royal Caribbean Cruises Ltd. (NYSEThe New York Stock Exchange (NYSE) is a global financial powerhouse, and at the heart of its performance measurement stands the NYSE Composite Index (NYA). This comprehensive index…: RCL) saw its stock surge by approximately 12% today, reaching an all-time high. This sharp increase comes on the heels of the company’s impressive fourth-quarter earnings report and a highly optimistic outlook for 2025. The cruise industry giant exceeded analysts’ expectations, demonstrating robust financial health, strong demand, and promising expansion initiatives.
Exceptional Q4 2024 Performance
Royal Caribbean delivered a standout financial performance in the fourth quarter of 2024. The company reported earnings per shareEarnings per share (EPS) is a fundamental financial metric that provides valuable insights into a company’s profitability. This widely used indicator helps investors and analysts g… (EPS) of $2.02, significantly surpassing Wall Street’s expectations of $1.50. This substantial earnings beat highlights the company’s strong revenue generation and operational efficiency, reinforcing investor confidence in its financial stability.
For investors, Royal Caribbean’s ability to consistently outperform expectations is a key indicator of its resilience in the travel and leisure sector. As consumers continue to prioritize experiences over material goods, the cruise industry stands as a major beneficiary of this shifting trend.
Bullish 2025 Forecast
Royal Caribbean’s outlook for 2025 has further fueled investor enthusiasm. The company projects full-year adjusted EPS between $14.35 and $14.65, marking a 23% increase in profitability compared to the previous year. This forecast outpaces analyst estimates, signaling strong momentumMomentum in stock trading refers to the rate of acceleration of a stock’s price or trading volume. It indicates the strength of a trend and measures how quickly prices are rising o… going into the new fiscal year.
Additionally, net yields are expected to grow by 2.5% to 4.5% in constant currency, demonstrating that the company can increase profitability through pricing strategies and enhanced onboard experiences. These financial projections affirm Royal Caribbean’s strong positioning within the leisure travel industry and reassure investors of its sustained growth trajectory.
Unprecedented Demand and Strong Pricing Power
A key driver of Royal Caribbean’s success has been its ability to generate record-breaking demand. The company recently experienced “the best five booking weeks in its history,” signaling an insatiable appetite for cruise vacations.
In addition to surging bookings, pricing trends remain favorable. Higher rates across key products and increased onboard spending are contributing to margin expansion. Furthermore, close-in demand—a crucial metric reflecting last-minute bookings—remains strong both in volume and pricing, demonstrating resilient consumer interest despite economic uncertainties.
This surge in demand places Royal Caribbean in a favorable position to sustain revenue growth while maximizing pricing power, two critical factors for long-term investor returns.
Strategic Expansion into River Cruises
One of the most intriguing developments in Royal Caribbean’s strategy is its planned expansion into river cruising. The company announced that it will launch river cruises in 2027, with bookings opening this year. This marks a significant shift into a high-margin market segment traditionally dominated by smaller operators like Viking and AmaWaterways.
The move into river cruising allows Royal Caribbean to diversify its offerings, tapping into a growing travel trend that attracts affluent, experience-driven consumers. Investors recognize this expansion as a potential catalystIn stock trading, a catalyst refers to an event, news, or announcement that causes a significant and often rapid price movement in a stock or the broader market. Catalysts can be p… for further revenue growth and brand differentiation within the competitive cruise industry.
Industry-Wide Growth Fuels Optimism
Beyond Royal Caribbean’s individual success, the broader cruise industry is experiencing a resurgence. Industry forecasts project that 19 million Americans will take a cruise in 2025, representing a 4.5% increase from 2024. This trend underscores the growing appeal of cruise vacations and provides a favorable macroeconomicAt its core, macroeconomics is the branch of economics that examines the behavior, performance, and structure of an economy as a whole. Unlike microeconomics, which focuses on indi… backdrop for Royal Caribbean and its competitors.
For investors, the expanding market size presents an attractive opportunity, as cruise operators stand to benefit from increasing consumer discretionary spending and a shift toward experiential travel.
Royal Caribbean Stock Trading Plan
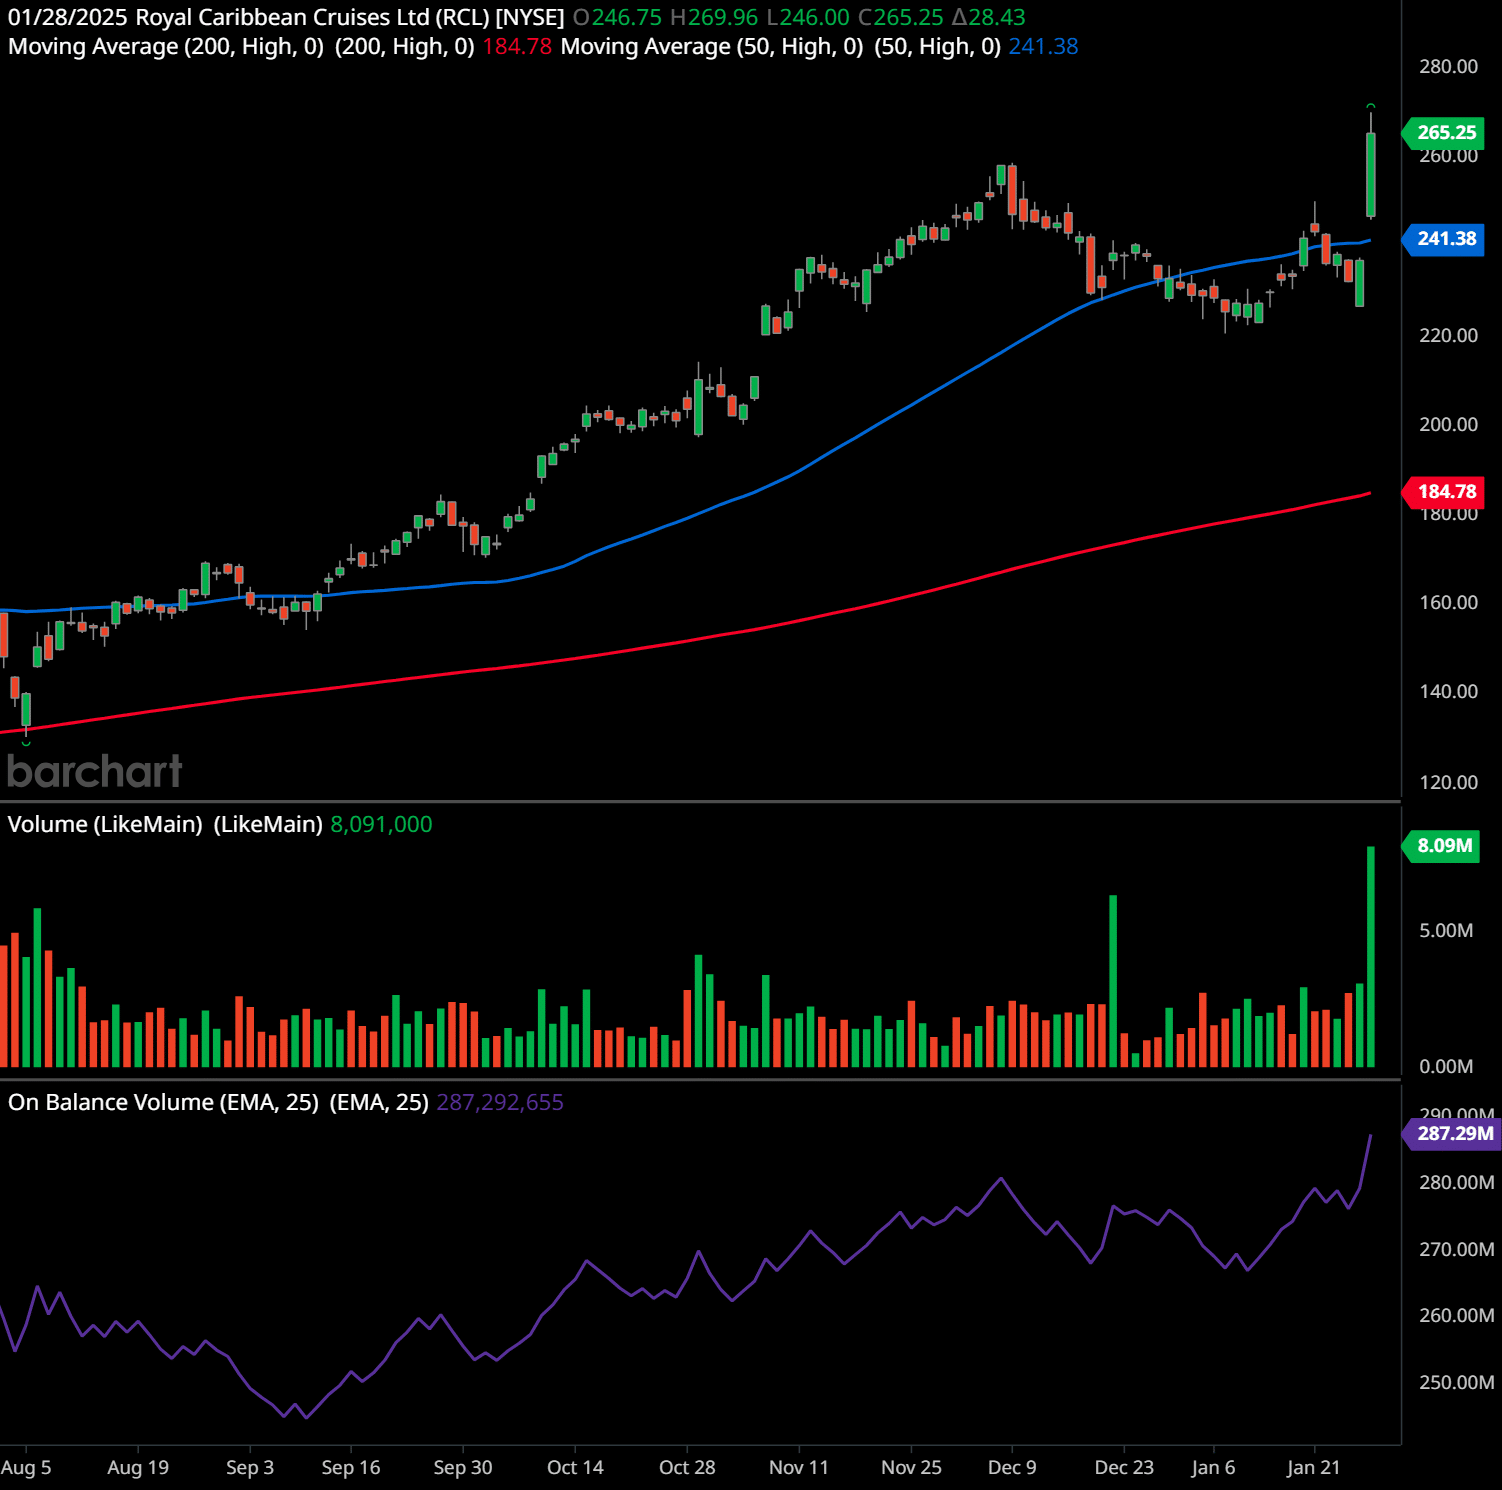
The chart for Royal Caribbean Cruises Ltd. (RCL) shows a strong bullish trend, highlighted by the following observations:
- Trend and MomentumMomentum in stock trading refers to the rate of acceleration of a stock’s price or trading volume. It indicates the strength of a trend and measures how quickly prices are rising o…:
The stock has been in an uptrend since early August 2024, with higher highs and higher lows forming consistently. The stock is trading well above the 200-day moving averageThe concept of moving averages dates back to the early 20th century. While it is challenging to attribute the invention of moving averages to a single individual, W. P. Hamilton, a… (currently at $184.78), indicating a strong long-term bullish trend. It has also broken above the 50-day moving averageThe concept of moving averages dates back to the early 20th century. While it is challenging to attribute the invention of moving averages to a single individual, W. P. Hamilton, a… ($241.38), reinforcing upward momentumMomentum in stock trading refers to the rate of acceleration of a stock’s price or trading volume. It indicates the strength of a trend and measures how quickly prices are rising o…. The large green candlestickCandlestick chart patterns are visual representations of price movements in financial markets, typically stocks, commodities, or currencies, during a specific time period. Each “ca… with significant volume suggests a powerful breakoutBreakout patterns occur when a stock price moves beyond a defined level of support or resistance with increased volume, signaling the potential start of a new trend. A breakout ind… to new highs, which reflects strong buying interest. - Support and Resistance Levels:
Immediate support is at the 50-day moving averageThe concept of moving averages dates back to the early 20th century. While it is challenging to attribute the invention of moving averages to a single individual, W. P. Hamilton, a… ($241.38). Below that, the 200-day moving averageThe concept of moving averages dates back to the early 20th century. While it is challenging to attribute the invention of moving averages to a single individual, W. P. Hamilton, a… at $184.78 serves as a critical long-term support. Resistance has been breached, with the stock reaching $269.96 during the session. The next psychological resistance level is at $280, based on the continuation of the upward trend. - Volume and On-Balance VolumeThe On Balance Volume indicator (OBV) is a technical analysis tool used to measure the flow of money into and out of a security over a specified period of time. It is a cumulative … (OBVThe On Balance Volume indicator (OBV) is a technical analysis tool used to measure the flow of money into and out of a security over a specified period of time. It is a cumulative …):
Volume spiked to 8.09 million shares, significantly higher than the recent average, confirming the validity of the breakoutBreakout patterns occur when a stock price moves beyond a defined level of support or resistance with increased volume, signaling the potential start of a new trend. A breakout ind…. The OBVThe On Balance Volume indicator (OBV) is a technical analysis tool used to measure the flow of money into and out of a security over a specified period of time. It is a cumulative … line has been steadily climbing and recently surged, showing that buying pressure has been persistent and is now accelerating. This reflects growing bullish trader sentiment. - Chart PatternsChart patterns are visual formations on price charts that occur due to the behavior of buyers and sellers in the market. These patterns often signal potential future price movement… and Trader PsychologyTrader psychology refers to the emotions and mental states that influence a trader’s decision-making process in financial markets. Emotions such as fear, greed, hope, and regret …:
The chart suggests a possible continuation pattern, such as a flag or consolidation breakoutBreakout patterns occur when a stock price moves beyond a defined level of support or resistance with increased volume, signaling the potential start of a new trend. A breakout ind…, that has resolved upward. The psychology behind the pattern indicates that buyers were in control throughout the prior trend and accumulated positions during recent dips. This breakoutBreakout patterns occur when a stock price moves beyond a defined level of support or resistance with increased volume, signaling the potential start of a new trend. A breakout ind… likely stems from optimism in the market, perhaps triggered by strong fundamentals or macroeconomicAt its core, macroeconomics is the branch of economics that examines the behavior, performance, and structure of an economy as a whole. Unlike microeconomics, which focuses on indi… tailwinds benefiting the cruise industry. - Indicators and Forecast:
The combination of a rising OBVThe On Balance Volume indicator (OBV) is a technical analysis tool used to measure the flow of money into and out of a security over a specified period of time. It is a cumulative …, moving averagesThe concept of moving averages dates back to the early 20th century. While it is challenging to attribute the invention of moving averages to a single individual, W. P. Hamilton, a… in bullish alignment, and high volume on the breakoutBreakout patterns occur when a stock price moves beyond a defined level of support or resistance with increased volume, signaling the potential start of a new trend. A breakout ind… suggests continued upward momentumMomentum in stock trading refers to the rate of acceleration of a stock’s price or trading volume. It indicates the strength of a trend and measures how quickly prices are rising o…. Short-term traders may target $280 or higher, while long-term traders could see potential for sustained gains if the broader market remains favorable.
Swing TradingSwing trading is a popular trading strategy aimed at capturing short- to medium-term gains by taking advantage of price swings in financial markets. Unlike day trading, which invol… Plan:
- Entry: $265–$268 range on minor pullbacks, following confirmation of strength.
- Stop-Loss: $240 to protect against a failed breakoutBreakout patterns occur when a stock price moves beyond a defined level of support or resistance with increased volume, signaling the potential start of a new trend. A breakout ind….
- Target: $280 as an initial target, with potential to extend to $290 if volume supports continued momentumMomentum in stock trading refers to the rate of acceleration of a stock’s price or trading volume. It indicates the strength of a trend and measures how quickly prices are rising o….
- Timeframe: 2-4 weeks.
Long-Term Trading Plan:
- Entry: Current levels or on pullbacks to the 50-day moving averageThe concept of moving averages dates back to the early 20th century. While it is challenging to attribute the invention of moving averages to a single individual, W. P. Hamilton, a… ($241).
- Stop-Loss: $180 to limit downside riskIn stock and crypto trading, risk refers to the possibility of losing some or all of the capital invested in a trade. It represents the uncertainty about the future performance of ….
- Target: $320–$350, assuming the uptrend remains intact and macroeconomicAt its core, macroeconomics is the branch of economics that examines the behavior, performance, and structure of an economy as a whole. Unlike microeconomics, which focuses on indi… conditions continue to support the travel sector.
- Timeframe: 6-12 months or longer.
Past performance is not an indication of future results. This analysis should not be considered investment advice. Always conduct your own research and consult with a financial advisor before making any investment decisions. 🧡
Why Investors Should Follow Royal Caribbean
Royal Caribbean’s strong financial performance, record-breaking demand, and strategic growth initiatives make it a compelling investment opportunity in the travel sector. With its stock reaching an all-time high, investors are signaling confidence in the company’s ability to sustain long-term growth.
Key reasons why investors should keep an eye on Royal Caribbean include:
- Proven financial resilience, as demonstrated by consistent earnings beats.
- Bullish 2025 outlook, with robust profit growth projections.
- Unparalleled demand, with record-high bookings and favorable pricing trends.
- Expansion into river cruising, unlocking new revenue streams.
- Industry-wide tailwinds, supporting sustained long-term growth.
As Royal Caribbean continues to innovate and capture market share, it remains a standout player in the travel and leisure sector. Investors seeking exposure to a high-growth segment within consumer discretionary stocks may find Royal Caribbean an attractive long-term holding.
Lance Jepsen is the senior personal finance writer for Guerilla Stock Trading who has spent more than 25 years covering the stock market and economics. In addition, Lance has worked as a private stock analyst for a number of high worth individuals.
Do you have a news tip for GuerillaStockTrading? Please email us at [email protected]
🗨️ JOIN OUR COMMUNITY OF STOCK TRADERS AND INVESTORS ON SOCIAL MEDIA
💥 GET OUR LATEST CONTENT IN YOUR RSS FEED READER
We are entirely supported by readers like you. Thank you.🧡
At GuerillaStockTrading, we maintain full transparency and impartiality; we never blog about stocks or crypto in which we hold a personal position unless explicitly stated in the article. Additionally, we do not accept paid promotions presented as content. All information shared is for informational purposes only and should not be construed as financial, investment, tax, or legal advice, nor as a recommendation to buy any security or financial asset. The content is general in nature and does not account for individual circumstances. It may not be suitable for your particular situation. Before making financial decisions, you are encouraged to seek guidance from your own financial or investment advisor.
Trading and Investment Ideas:
Source link