Could The RSP / SPY Ratio Be A Breadth Indicator?
Contents
To understand the RSP versus SPY ratio, we first need to know what each represents.
SPY is an ETF that tracks the S&P 500, which is composed of 500 large-cap, blue-chip U.S. companies.
In SPY, each company’s weight in the fund is based on its market capitalization.
Hence, larger companies have a greater influence on price.
RSP is the Invesco S&P 500 Equal Weight ETF.
It holds the same 500 stocks but weights each company equally.
This gives small and large companies the same impact on the fund’s movement.
Comparing the two helps us see whether market gains are being driven by a few large companies or are more broadly distributed across the market.
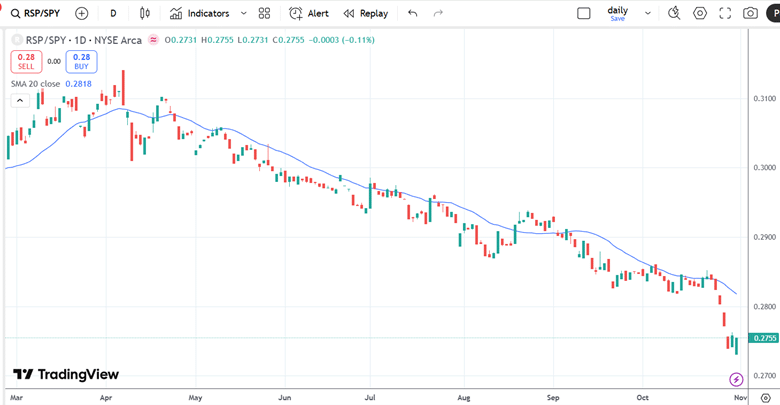
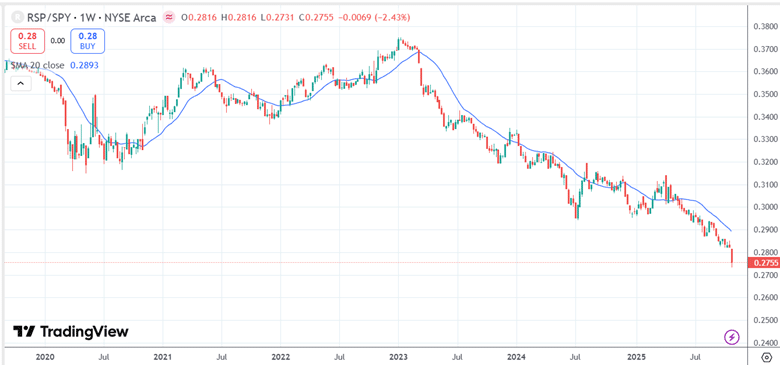
If we put “RSP / SPY” in the ticker field of TradingView, we see a declining RSP/SPY ratio for the past six months starting in April 2025 through October…
One way to think about the price performance of an ETF is that each company in the fund gets a “vote” as to whether to go up or to go down.
If the company stock price goes up, that will make the fund price go up.
And vice versa.
In SPY, the bigger the company, the larger its “vote”.
In RSP, each company gets an equal “vote” regardless of size.
So its performance reflects the average movement of all 500 companies rather than being dominated by the largest ones.
A declining RSP versus SPY ratio means that SPY price is rising faster than RSP.
In other words, the largest companies are pushing the market higher while the rest of the S&P 500 lags behind.
The analogy is like SPY represents the voice of the generals leading an army of troops forward.
RSP represents the voice of the troops.
When the generals say to climb higher and the troops refuse, we have a problem.
This situation is known as declining breadth, where only a few large companies are driving prices higher.
In a healthy, sustainable rally, we want to see broad market participation with many stocks rising, not just a select few.
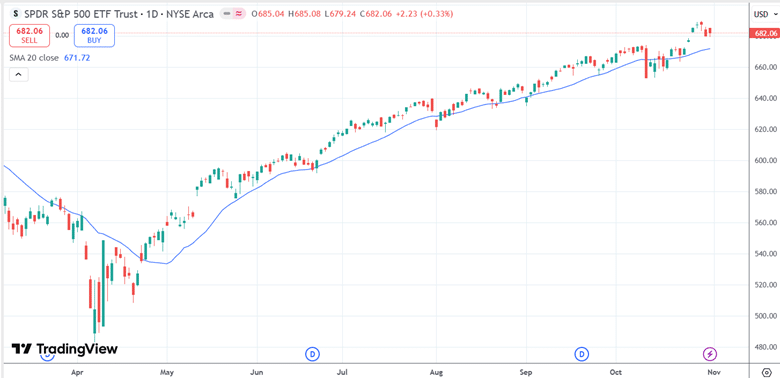
A falling RSP/SPY ratio is therefore a sign of weakening breadth, which can be concerning – especially when we see a precipitous drop in the ratio at the end of October in the above chart.
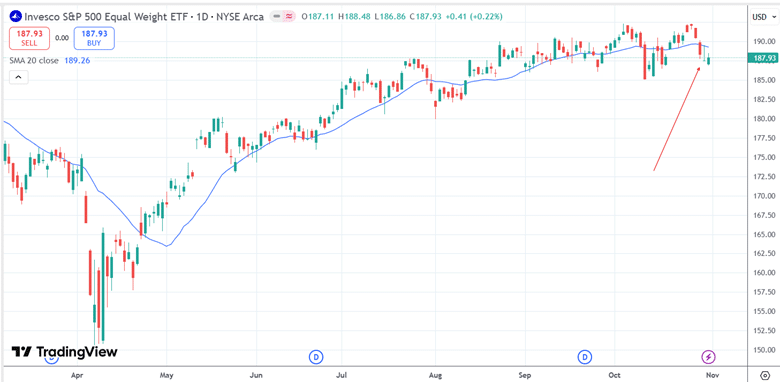
If we look at the week of October 27th, 2025, we see that RSP fell that week as shown by the last five candles…
The SPY looks stronger…
This discrepancy causes the RSP / SPY ratio to decline.
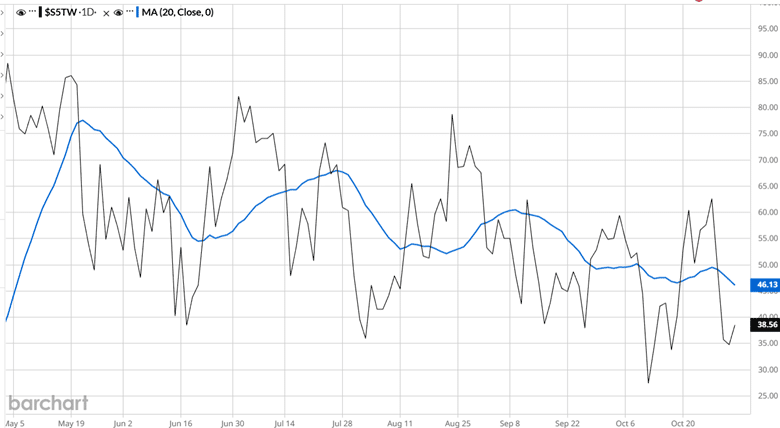
The lower breadth readings are reflected in traditional breadth indicators as well.
If you look at Barchart’s symbol “$S5TW” which graphs the percentage of stocks above its 20-day moving average, we see it at 38% by the end of October.
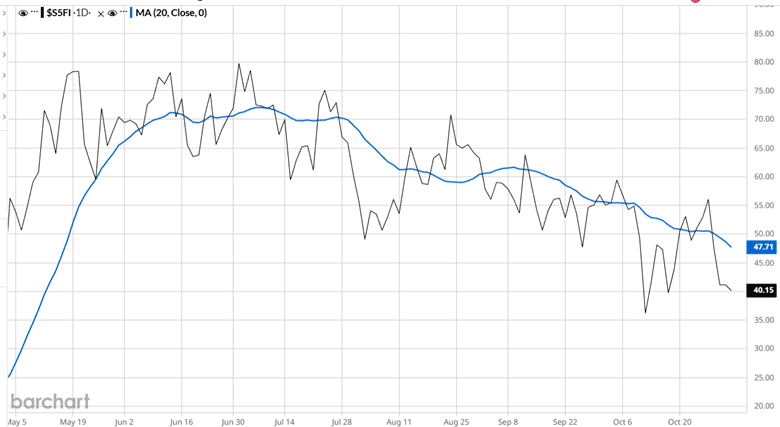
Similarly, the $S5FI shows the percentage of stocks above its 50-day moving average at 40%…
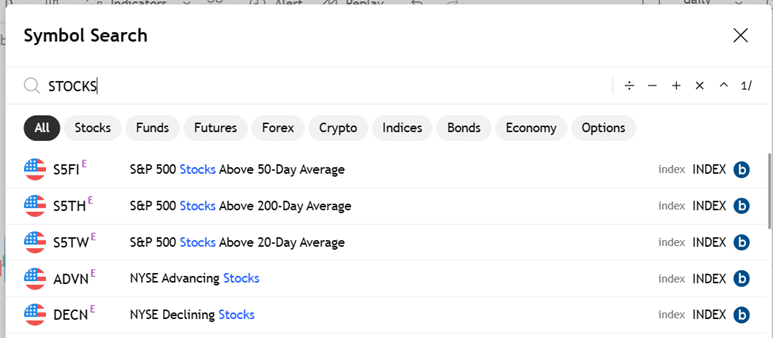
Incidentally, you can get these barchart breadth indices in TradingView as well.
Just type “stock” in the symbol search…
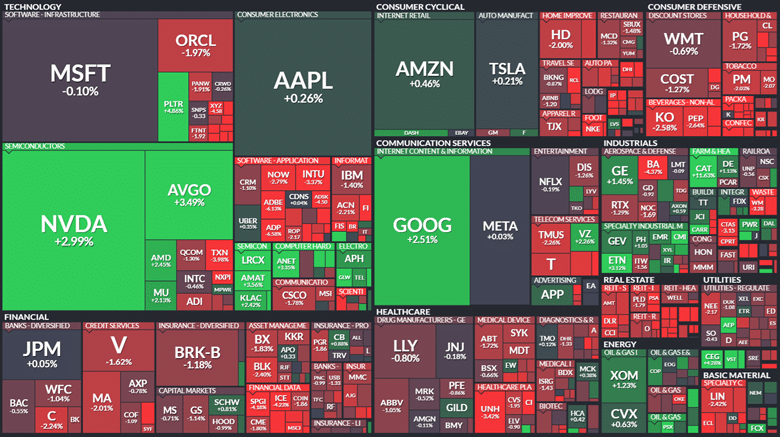
Another way to look at breadth is to look at a heat map.
Here is the heatmap at the close of Oct 29th, 2025…
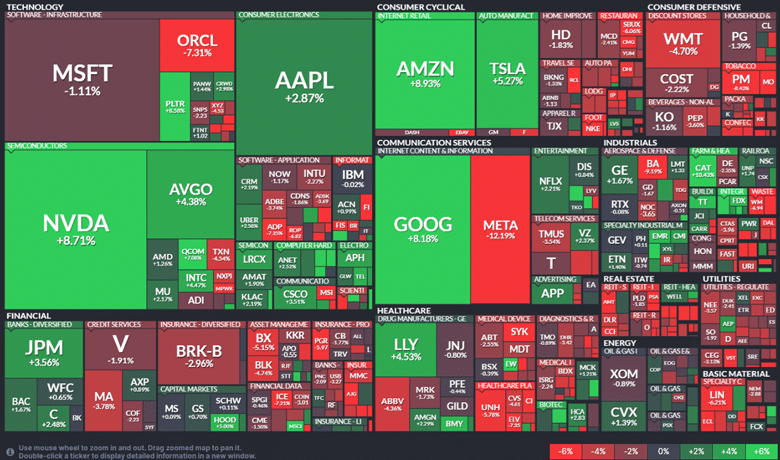
You can change the timeframe in these heatmaps.
Here is the heatmap for the last week of October 2025…
In either case, a lot of reds and only a few spots of green.
The heatmap also gives a sense of who the large players are.
Because the size of the square represents the company’s market cap.
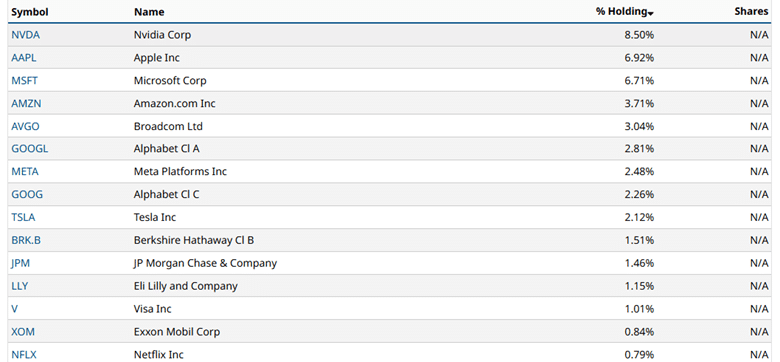
In barchart’s “constituents” menu, we can see the size that each player represents in SPY.
We see that Nvidia represents 8.5% of the ETF.
Apple comes in seconds with nearly a 7% effect on SPY’s price.
The Magnificent Seven companies (Apple, Microsoft, Alphabet, Amazon, Nvidia, Meta, and Tesla) make up about 35% of the S&P 500 index.
When seven companies represent a third of the index and 493 companies make up the remainder, is that a balanced index?
What is interesting is that if we look at the weekly chart of “RSP/SPY”, the declining breadth started in 2023 shortly after OpenAI released ChatGPT in November 2022.
The declining ratio is driven by the surge in SPY’s performance, fueled by rising AI enthusiasm and the soaring stock prices of the Magnificent Seven companies involved in the AI development race.
The RSP versus SPY ratio as well as traditional breadth indicators can help traders be informed of the breadth of the market.
Market breadth weakens if only a handful of mega-caps stocks are pushing the indexes higher.
This can serve as an early warning sign that a rally may not be sustainable.
Trade safe!
Disclaimer: The information above is for educational purposes only and should not be treated as investment advice. The strategy presented would not be suitable for investors who are not familiar with exchange traded options. Any readers interested in this strategy should do their own research and seek advice from a licensed financial adviser.

Source link