Growth Investing: Using the Rule Of 40 with Practical Examples
Growth investing can feel like a tightrope walk—do you chase expansion or focus on profits?
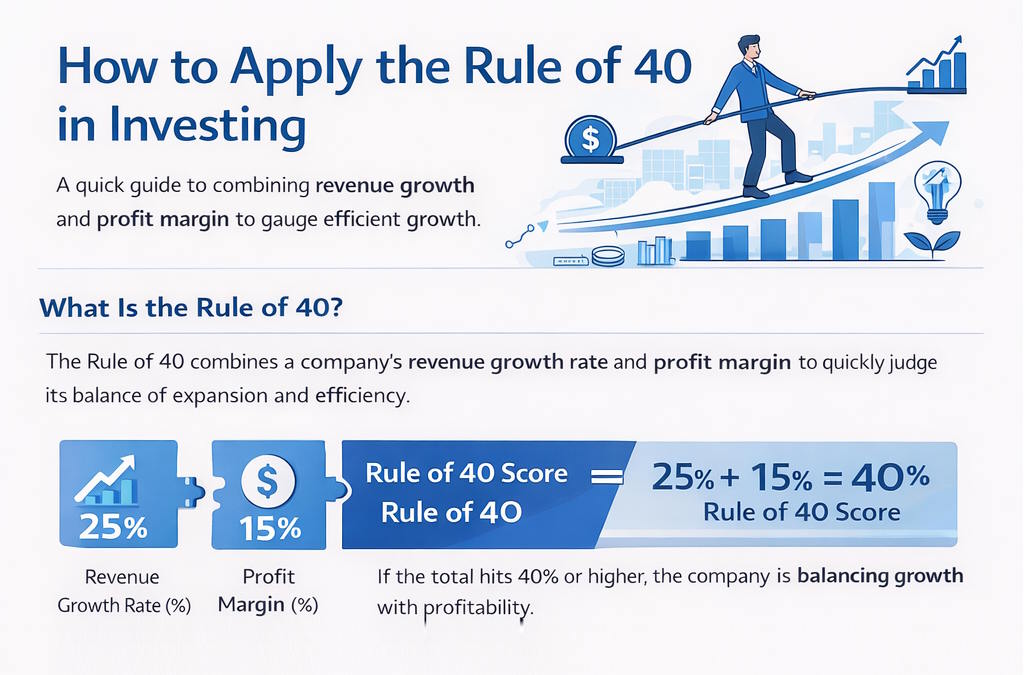
The Rule of 40 gives you a quick, straightforward way to judge if a company’s growth is actually worth its price tag. You just add up the revenue growth rate and profit margin, and that number tells you if the company’s growth story really holds water.
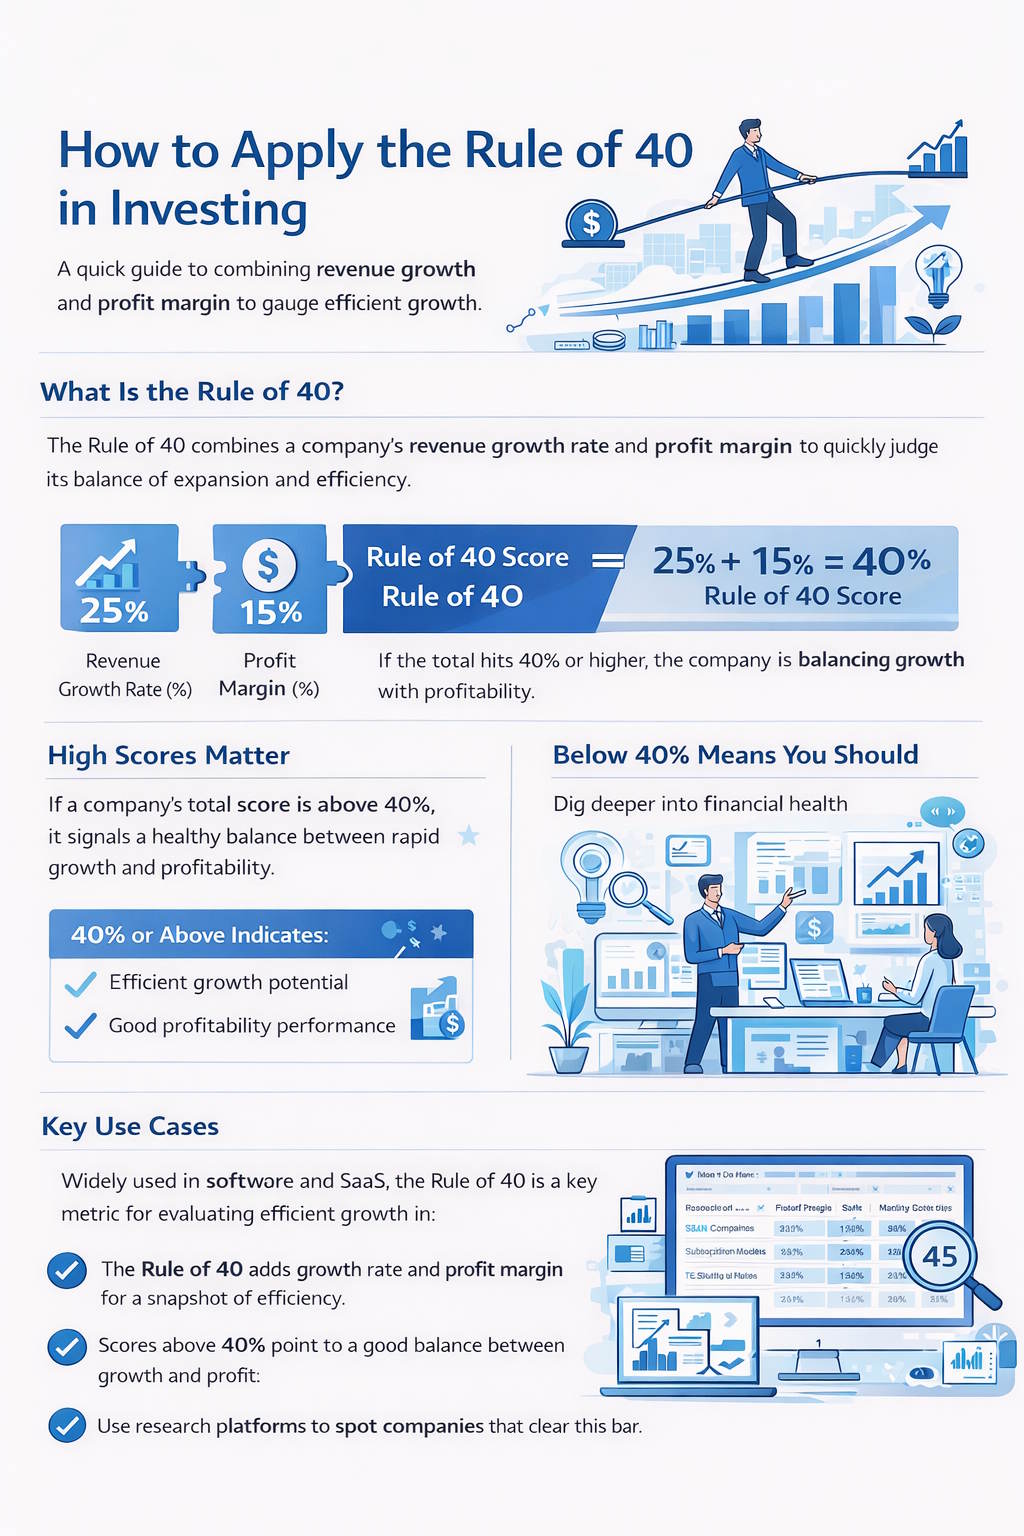
You’ll see this metric appear across high-growth sectors, but it’s almost a standard in software and SaaS, where profits are often sacrificed for speed. If a company scores above 40%, it’s a sign that it’s balancing growth and profitability. If it’s lower, you should probably dig deeper into whether their strategy makes sense in the long term.
Tools like Stock Rover let you screen for companies that meet—or exceed—this threshold, regardless of industry.
Key Takeaways
- The Rule of 40 combines growth rate and profit margin to provide a snapshot of efficiency.
- Scores above 40% point to a good balance between growth and profit.
- Use research platforms to spot companies that clear this bar.
What Is the Rule of 40?
The Rule of 40 helps you figure out if a company—especially a SaaS or software firm—balances growth and profitability well. It’s a quick gut check before you dive into the weeds, used by both investors and operators.
Core Formula and Threshold
Here’s the formula:
If the total hits 40% or higher, the company clears the bar. Above 40%? That’s usually efficient growth. Below 40%? You might be looking at a business that’s either growing too slowly or burning too much cash.
You can use either EBITDA margin or free cash flow margin for the profit side, depending on the company’s reporting. In SaaS, recurring revenue growth tends to matter more since it shows subscription stickiness.
Let’s say a company grows revenue 30% each year and posts a 15% EBITDA margin. Its Rule of 40 score is 45%—so they’re doing something right. Stock Rover makes it easy to run these numbers and compare companies side by side.
Origins and Industry Adoption
Venture capital and private equity folks started using the Rule of 40 in the 2010s. Brad Feld, a well-known VC, helped popularize it as a way to size up high-growth software companies—especially when profits lag behind revenue.
Consultants at McKinsey jumped on board, pointing out how useful it is for benchmarking SaaS firms across different market cycles. It’s become a kind of shorthand: can management grow without torching the cash pile?
Startups and public companies now use the Rule of 40 for setting internal targets. Boards and investors rely on it to keep everyone focused on scaling sustainably, not just on growth for its own sake.
Key Entities and Use Cases
You’ll mostly see the Rule of 40 used for SaaS companies, but it also applies to other subscription-based or digital service models. Venture capitalists use it to screen early-stage investments, and public market analysts apply it to tech and cloud stocks.
For management, it’s a reality check. If your score’s low, it may be time to cut costs or adjust pricing. If it’s high, you might have room to invest more in product or sales.
Platforms like TradingView let you track revenue growth and margins over time. Comparing these scores across competitors can show which companies actually balance expansion and profit—and which are just burning fuel.
How to Calculate the Rule of 40
To measure the Rule of 40, you just combine your company’s revenue growth rate and profitability. The whole point is to determine whether your business grows fast enough to justify its profits, or whether your profits are high enough to offset slower growth.
This allows investors and managers to compare SaaS and tech firms with very different cost structures on a level playing field.
Revenue Growth Rate Explained
Start with revenue growth rate—how fast your top line increases year over year. Here’s the formula:
Stick to consistent periods, usually annual, so you don’t end up with weird, misleading results. If a company jumps from $10 million to $13 million in revenue, that’s a 30% growth rate.
Double-check if growth comes from organic sales or acquisitions. The Rule of 40 works best when you focus on organic growth, since mergers can muddy the waters.
Stock Rover tracks this metric for you, pulling historical revenue data and showing growth trends. Looking at multi-year averages helps you avoid being misled by one-off spikes or dips.
Profitability Metrics: EBITDA, Free Cash Flow, and Margins
Profitability makes up the other half of the Rule of 40. You’ve got a few options, depending on how your company reports:
| Metric | Formula | Description |
|---|---|---|
| EBITDA Margin | EBITDA ÷ Revenue | Focuses on core operating profit before interest, taxes, depreciation, and amortization. |
| Free Cash Flow Margin | Free Cash Flow ÷ Revenue | Reflects cash efficiency after capital expenditures. |
| Operating Margin | Operating Income ÷ Revenue | Includes depreciation and other operating costs. |
Each margin tells you what percent of revenue turns into profit. In SaaS, adjusted EBITDA margin is common since it strips out non-cash or one-time charges.
If you’re running negative margins, you’ll need a growth rate above 40% to get a strong Rule of 40 score. Tracking these numbers quarterly can show whether your efficiency is improving.
Rule of 40 Score Calculation
Once you have your growth rate and margin, just add them up:
For example, a company with 25% annual growth and a 20% EBITDA margin scores 45—easily clearing the 40% mark. That’s a sign of balanced growth and profit.
If you land below 40, either growth is too slow, or spending is too high. Some investors prefer using free cash flow margin instead of EBITDA to assess sustainability.
TradingView charts let you visualize these numbers, so you can see how your company compares to the sector or direct competitors.
Common Calculation Pitfalls
Don’t mix timeframes—if you use quarterly growth, use quarterly margins too. Keep it apples to apples.
Exclude one-off gains or losses from EBITDA to avoid inflated margins. Adjust for deferred revenue if you bill customers up front.
Don’t combine gross margin with revenue growth unless you also account for operating costs; gross margin alone misses overhead and sales expenses.
Just keep in mind, the Rule of 40 is a screening tool—not a full-blown valuation model. Pair it with metrics like EV/Sales or free cash flow yield to get a real sense of a company’s efficiency and market value.
Applying the Rule of 40 to SaaS and Software Companies
The Rule of 40 lets you gauge how well a SaaS or software company juggles growth and profit. It connects revenue growth, margins, and efficiency to long-term financial strength—and, honestly, to how attractive a company looks to investors.
When the Rule of 40 Applies
You’ll want to use the Rule of 40 when you’re looking at SaaS or subscription-based software companies that rely on recurring revenue. It matters most once there’s steady ARR (annual recurring revenue), and you can actually measure profit margins.
This metric really shines for growth-focused companies where both speed and efficiency count. If a company grows revenue 30% and has a 15% profit margin, its score is 45—solid. On the flip side, a high-growth company with negative margins might still pass muster if its growth is strong enough to offset losses.
Investors use the Rule of 40 as a quick filter for sustainable growth, not as a hard-and-fast rule. Tools like Stock Rover help you analyze financial ratios and growth across software companies before you invest.
Growth Stages and Lifecycle Context
Early-stage SaaS companies usually care more about hypergrowth than profit, so their Rule of 40 score might fall short. That’s not a red flag if net revenue retention (NRR) is above 110% and customer acquisition stays efficient.
As companies get bigger, growth slows, and investors expect margins to improve. Mid-stage firms often aim for something like 20% growth and 20% margin. Mature software companies may focus on boosting margins, using the Rule of 40 to show they’re running a tight ship.
Context is everything. Comparing a startup to a large, established player without adjusting for stage can significantly skew your analysis. Benchmark against companies at similar revenue and growth levels to determine whether a sub-40 score is a problem or just a phase.
Operational Efficiency and Sustainability
The Rule of 40 also gives you a read on operational efficiency—how well a company turns growth into cash. High sales efficiency and tight cost control push margins up without killing growth.
Monitor metrics such as NRR, churn, and customer acquisition cost to assess whether growth is sustainable. Sure, a company can hit 40 just by spending aggressively, but that quickly drains cash. Real sustainability means moderate growth plus steady profits.
TradingView charts let you plot revenue and margin trends over time, making it easier to spot whether a company’s growth path is still efficient or starting to look risky.
Practical Examples: Rule of 40 in Action
The Rule of 40 highlights how software companies manage the trade-off between growth and profit. You can use it to compare a range of business models, from pure-play SaaS to platforms that mix subscriptions and enterprise sales.
Case Study: Atlassian
Atlassian stands out for consistent revenue growth and tight expense control. Over the last few years, revenue has grown around 25–30% annually, and operating margins have improved to about 10–15%. That keeps Atlassian above the 40% mark in most quarters.
Their model—self-serve signups, low sales costs, and recurring subscriptions—enhances efficiency. Products like Jira and Confluence drive steady growth without massive marketing spend.
Stock Rover lets you screen Atlassian’s fundamentals and watch its growth vs. profit balance as it scales.
Case Study: Salesforce
Salesforce demonstrates how a large SaaS company can remain near the Rule of 40 even as growth slows. Revenue growth has dropped to around 11–13%, but operating margin has climbed toward 25–30%, keeping the score close to 40%.
Acquisitions like Slack did hit margins for a while, but recurring revenue and smart cost controls steadied things. Investors often see its reliable free cash flow as a sign of strength, even when growth isn’t as hot.
If you pull up Salesforce on Seeking Alpha, you can compare its Rule of 40 track record to smaller competitors and see how efficiency changes after big deals.
Case Study: GitLab and Palantir
GitLab and Palantir take different routes to the Rule of 40. GitLab has revenue growth above 30%, but negative margins keep it below the benchmark. Palantir, meanwhile, has shifted from losses toward profit, with margins improving as growth slows into the mid-teens.
Both cases show that early-stage software companies often accept margin losses to build scale. If you track these metrics, you can spot when a company shifts from pure growth to a more balanced approach.
TradingView lets you chart GitLab and Palantir’s quarterly growth and margins, so you can see how each is moving toward that 40% efficiency mark.
Other High-Profile Software Stocks
Other growth stocks, such as Zoom, ServiceNow, and Adobe, illustrate how the Rule of 40 plays out across different stages. Zoom’s growth rate slowed after the pandemic, but its improving margins kept the company near the threshold.
ServiceNow continues to deliver strong double-digit growth with tight profitability. Adobe, now a mature player, relies on high margins to offset its slower revenue growth.
If you’re screening software stocks, the Rule of 40 gives you a fast way to check efficiency. Tools like TrendSpider automate charting of growth and margin data, so you can spot trends before they appear in quarterly reports.
How Investors Use the Rule of 40
You use the Rule of 40 to see if a company balances growth and profitability in a way that actually makes sense. This metric lets you compare companies, set specific benchmarks, and spot when aggressive growth hides weak margins or rising customer acquisition costs.
Investment Decisions and Benchmarks
The Rule of 40 combines the revenue growth rate and profit margin to show how well a company scales. If the sum tops 40%, you’re looking at a healthy growth-profit balance. Venture capitalists lean on this for SaaS and subscription models, where reinvestment levels run high.
You can screen growth stocks with it before digging deeper. If a company reports 30% annual growth and a 15% operating margin, that’s a score of 45—a solid sign. Firms under 40% aren’t out, but you want to see improving margins or a lower burn rate.
Many investors use Stock Rover to screen for companies that regularly beat the 40% mark. You can filter by revenue growth, EBITDA margin, or free cash flow to find efficient operators. Treat this as your first filter, then dive into customer retention, CAC trends, or pricing power.
Comparing Companies and Peer Analysis
You use the Rule of 40 to stack companies up against each other in the same sector, especially in software and tech. It helps normalize performance when growth rates differ. A company growing 50% but losing 20% margin (score 30) actually trails a peer growing 25% with a 20% margin (score 45).
This method helps you spot sustainable growth models. Companies with usage-based pricing or robust premium features often post steadier Rule of 40 scores since recurring revenue covers acquisition costs.
When you compare peers, track the metric over several quarters. A steady score above 40 points indicates stable scaling. Use TradingView to chart revenue and margin trends and see if the balance is moving in the right direction.
Limits and Trade-Offs for Investors
The Rule of 40 simplifies messy financials, but it’s not perfect. It omits cash flow timing, debt, and one-off expenses that can distort margins. Sometimes a company hits 40% only by slashing costs unsustainably or slowing growth too much.
Pair this metric with customer acquisition cost (CAC), lifetime value, and churn stats. If CAC climbs faster than revenue, a high Rule of 40 score doesn’t mean much.
You’ll also want to adjust by company stage. Early startups might lag while plowing cash into growth, but mature firms should clear the threshold. Treat it as a guide, not a gospel, and always back it up with a thorough review of the numbers before you invest.
Beyond the Rule of 40: Next Steps and Related Metrics
You can’t just lean on one ratio to judge a company’s health. The Rule of 40 provides a snapshot of growth versus profitability, but you need additional metrics, context, and forward-looking indicators to get the full picture.
Complementary Metrics and Ratios
Pair the Rule of 40 with other profitability metrics to see how well a company turns revenue into returns. Some key ratios:
| Metric | What It Measures | Why It Matters |
|---|---|---|
| Gross Margin | Profit after direct costs | Tests pricing power |
| Operating Margin | Profit after operating costs | Reveals cost discipline |
| Free Cash Flow Margin | Cash available after expenses | Signals sustainability |
| Return on Invested Capital (ROIC) | Profit vs. capital used | Gauges efficiency |
Compare these against growth rates to catch imbalances. For example, a SaaS firm growing 60% but with a negative 25% operating margin scores 35 on the Rule of 40—close, but cash burn might still be a problem.
Use Stock Rover to filter companies by revenue growth, cash flow, and ROIC, and see if strong Rule of 40 scorers also post better margins.
Adapting the Rule for AI and Product-Led Growth
AI adoption and product-led growth (PLG) models are changing cost structures and growth patterns. AI tools can boost gross margins by automating support or analytics, but they often need a big upfront investment. PLG companies may show slower early revenue but better retention and lifetime value once adoption accelerates.
You’ll want to adjust expectations. Instead of a hard 40% line, track revenue efficiency—annual recurring revenue (ARR) growth per dollar of sales and marketing spend.
If AI is driving productivity, it might make sense to tolerate a temporary dip in profit margin if efficiency metrics are clearly improving. Use Trade Ideas or TradingView to see how the market values AI-driven firms compared to traditional SaaS companies.
Checklist for Evaluating Growth Companies
Before you invest, ensure a company’s growth aligns with sustainable economics. Look for:
- Consistent revenue growth above 20% each year
- Positive or improving free cash flow
- Stable or rising gross margins
- Low customer acquisition cost (CAC) compared to lifetime value (LTV)
- A clear path to profitability within 3–5 years
- Evidence that AI or automation is boosting efficiency
Keep your findings in a simple table or dashboard. Update it quarterly as new financials are released. Use Seeking Alpha for peer comparisons and analyst opinions to double-check your assumptions before you invest.
FAQ
Which types of companies should be evaluated using the Rule of 40, and why?
The Rule of 40 works best for SaaS and other subscription-based tech companies. These businesses usually reinvest heavily in customer acquisition and product development, which can squeeze short-term profits.
You can also apply it to other high-growth sectors, such as fintech and digital media, where recurring revenue and scalability matter more than immediate net income.
What are the potential pitfalls of relying solely on the Rule of 40 for investment analysis?
The metric skips over cash flow quality, debt, and capital efficiency. Sometimes a company hits 40% only by spending aggressively or with one-off gains.
It also doesn’t factor in market shifts or competitive threats. Always double-check against full financial statements and qualitative factors before making investment decisions.
What are the limitations of the Rule of 40 in predicting long-term growth and profitability?
You’re only getting a snapshot, not a real forecast. The Rule of 40 won’t tell you if a company can actually keep growing, or if its margins might shrink once competitors catch up.
It skips over valuation entirely. Even if a company nails the Rule of 40, you could still end up overpaying compared to similar businesses. Treat it as just one piece of your larger evaluation puzzle.
Source link