Stock Sector Rotation Investing Explained for Beginners
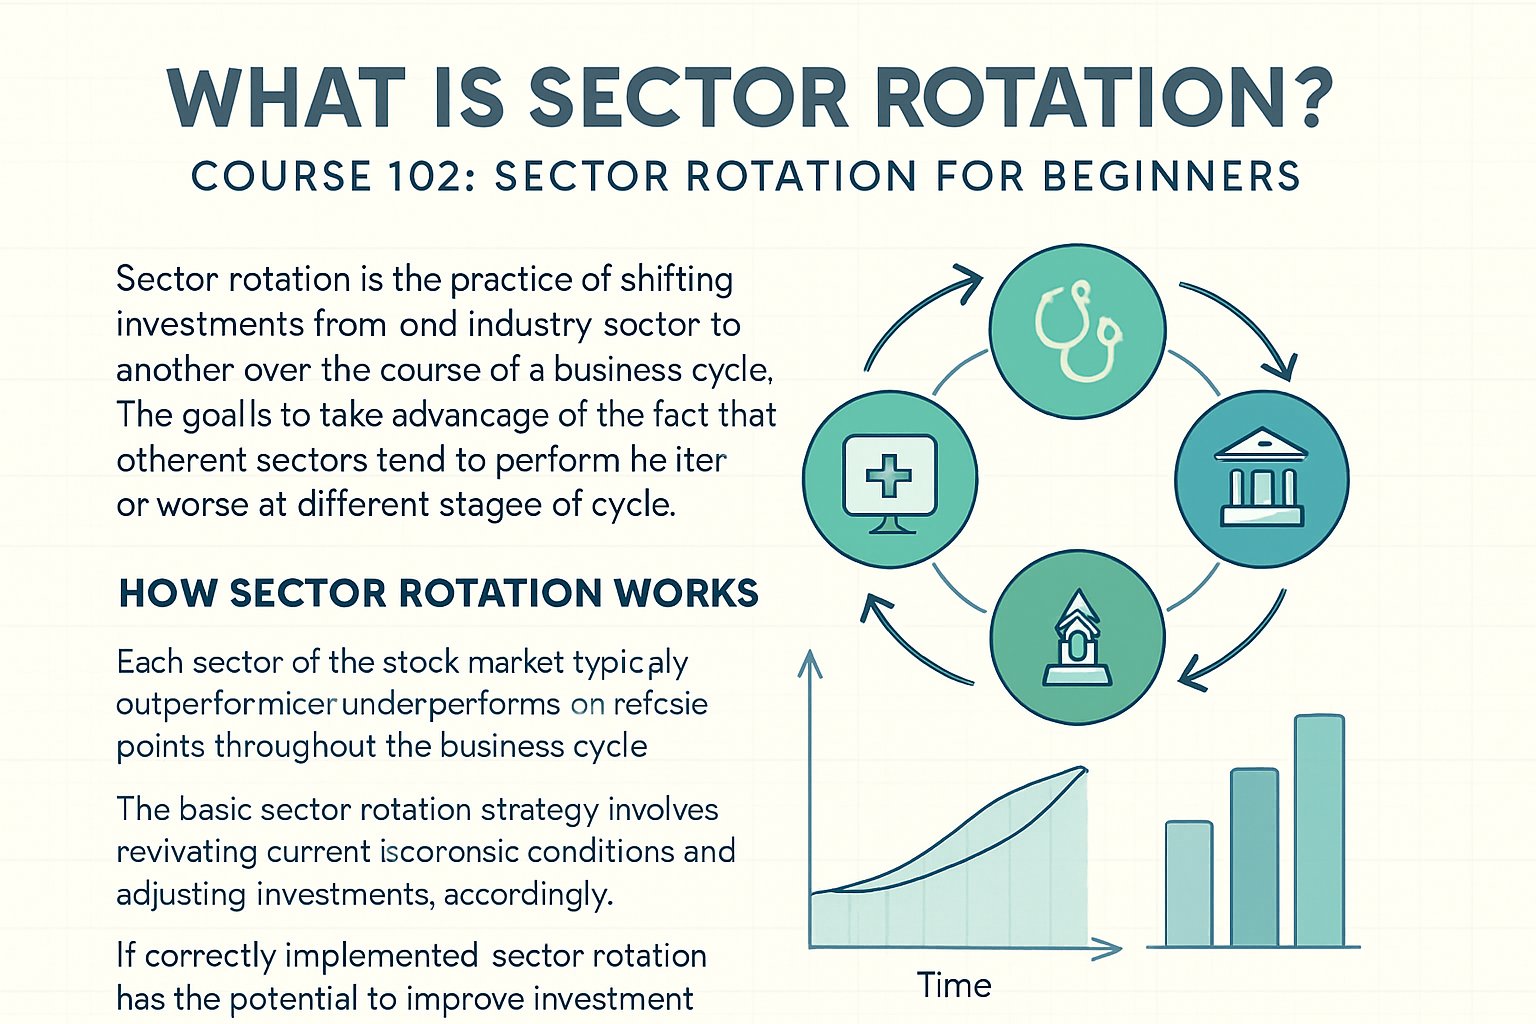
Sector rotation means shifting your investments among industries that typically outperform at different stages of the economic cycle. Instead of spreading out across every sector all the time, you focus on where growth or stability seems most likely next.
You’ll learn how to spot when technology, energy, or healthcare might take the lead—or when defensive sectors like utilities and consumer staples could offer a safer spot. With tools such as Stock Rover for screening and comparing sector performance, you can base your moves on actual data rather than hunches.
This approach helps you align your portfolio with genuine economic signals, not just the latest market chatter.
When you stick to simple rules and time your moves with discipline, you can build a plan that adapts to changing markets. You’re not trying to predict every twist; you’re just aiming to notice clear trends and act with some confidence.
Key Takeaways
- Sector rotation is the process of shifting investments in line with economic and market cycles.
- Data tools let you spot which sectors are gaining or losing strength.
- A disciplined strategy helps improve timing and reduce emotional decisions.
What Is Sector Rotation?
Sector rotation is all about how money shifts between industries as the economy grows, stalls, or contracts. You use it to figure out which market sectors will likely outperform or lag during each phase of the business cycle, helping you allocate capital more wisely and manage your portfolio’s risk.
Definition and Core Principles
Sector rotation is an investment strategy in which you allocate capital across market sectors—such as technology, healthcare, and utilities—based on where each sector sits in the economic cycle. The goal is to stay invested in sectors showing relative strength and reduce exposure to those losing momentum.
You track performance trends, earnings growth, and sector-specific indicators to decide when to rotate. For example, people often shift from cyclical sectors such as consumer discretionary to defensive ones such as utilities when growth slows.
Here’s a basic checklist:
- Figure out the current stage of the business cycle.
- Compare sector performance against benchmarks such as the S&P 500 sector indices.
- Double-check trends with technical tools such as TrendSpider for automated chart analysis.
This method relies on evidence, not guesswork, and works best when you check the data regularly rather than reacting to every market blip.
How Sector Rotation Differs from Other Strategies
Unlike buy-and-hold investing, sector rotation involves active management. You adjust your holdings as conditions shift, instead of sticking with a fixed asset mix. The strategy focuses on how sectors perform relative to one another—not on picking individual stocks.
Value investing looks for undervalued companies, regardless of sector. Momentum trading follows price trends but may overlook the broader economic picture. Sector rotation blends both—you use macroeconomic data and performance momentum to guide your timing.
It’s also not the same as asset allocation, which spreads risk across stocks, bonds, and cash. Sector rotation remains within stocks but shifts between sectors to capture performance cycles.
You can use tools like Stock Rover to compare sector fundamentals and screen for leading industries. That way, you’re making decisions based on data, not just market mood.
Role of Economic Cycles
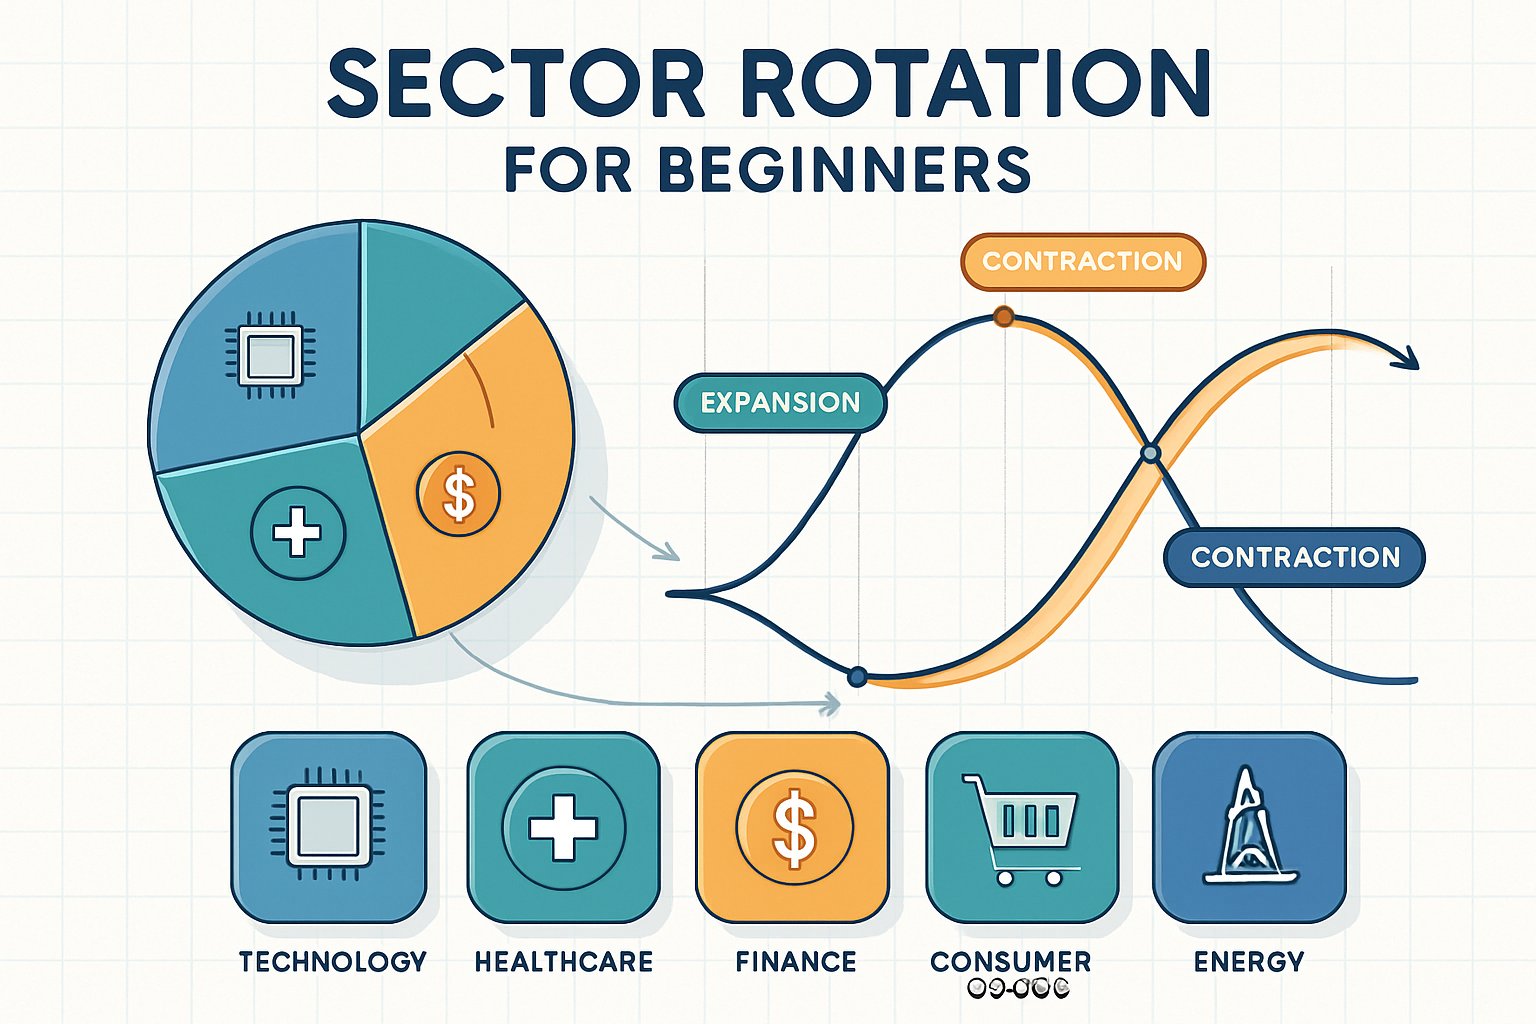
The business cycle is what drives sector rotation. Each phase—expansion, peak, contraction, recovery—changes which sectors lead or lag. During expansions, consumer discretionary and industrials usually outperform. When growth slows, investors often turn to defensive sectors like healthcare and utilities.
If you understand these patterns, you can anticipate moves rather than react. For example, early recovery phases often boost financials and technology, while late-cycle stages tend to lift energy and materials.
Here’s a quick breakdown:
| Cycle Phase | Typical Leading Sectors | Typical Lagging Sectors |
|---|---|---|
| Early Recovery | Financials, Technology | Utilities, Consumer Staples |
| Mid Expansion | Industrials, Materials | Energy, Real Estate |
| Late Expansion | Energy, Materials | Technology, Consumer Discretionary |
| Recession | Utilities, Healthcare | Financials, Industrials |
You can monitor these shifts in TradingView, which provides sector performance charts and global market data. Tracking sector rotations alongside macroeconomic indicators—like GDP growth and interest rates—gives you a more grounded way to time your adjustments.
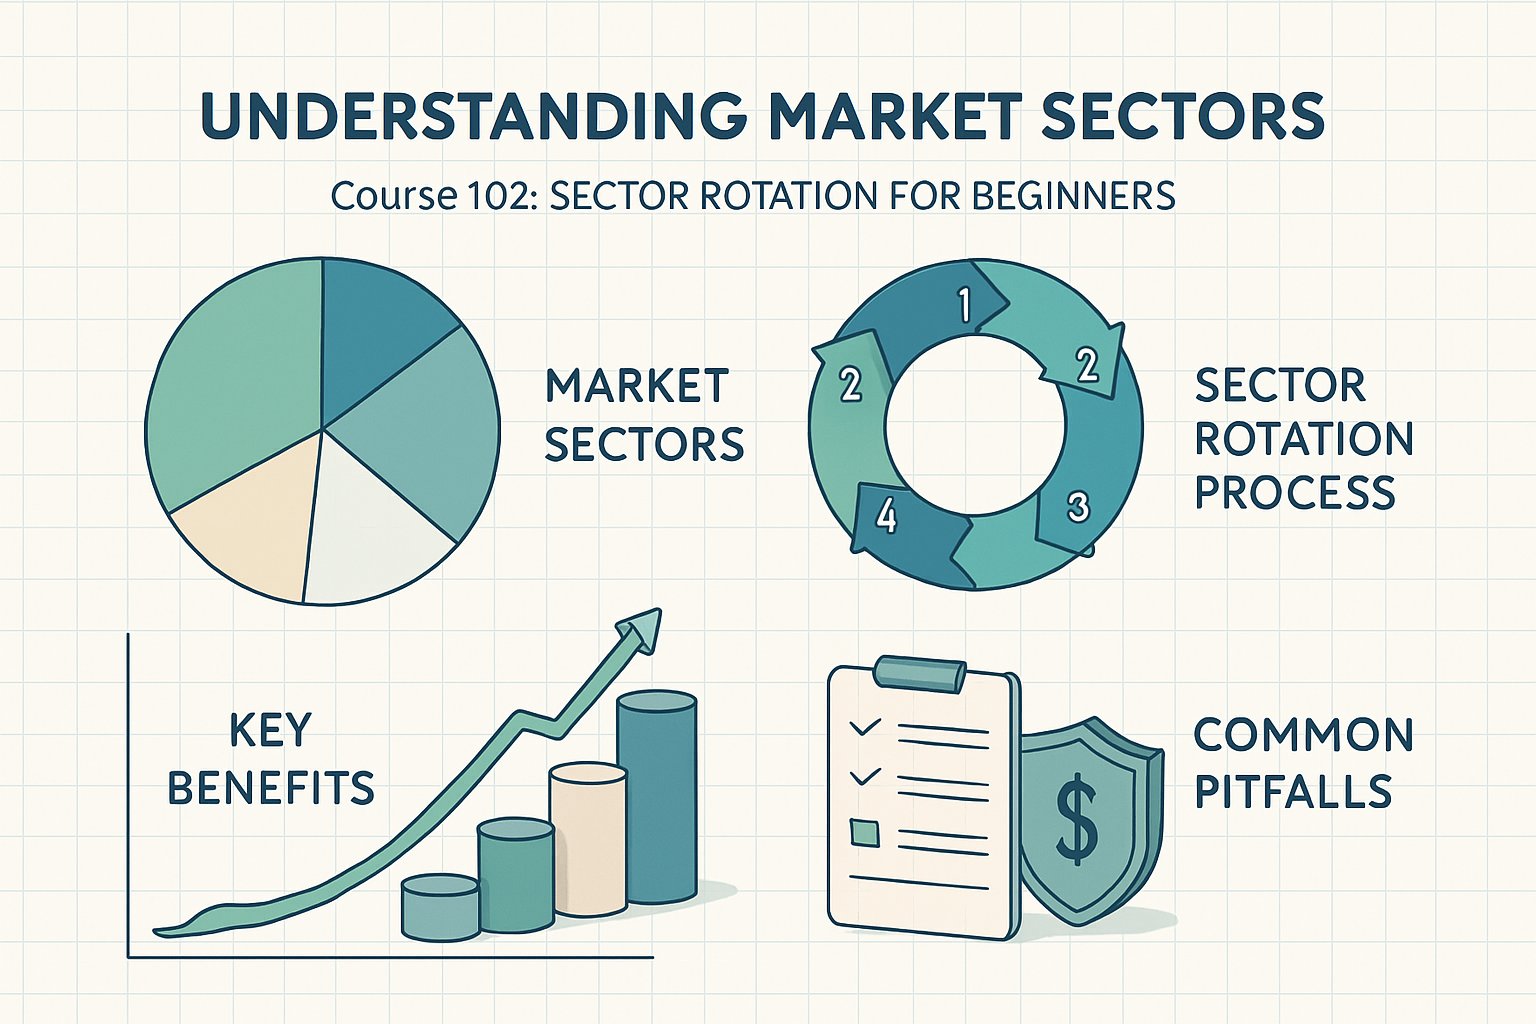
Understanding Market Sectors
You split the stock market into groups called sectors, each tied to a certain part of the economy. Understanding how these sectors perform under different economic conditions helps you allocate capital more effectively and manage risk in your portfolio.
Overview of Major Sectors
Market sectors group companies by their main business activity. The Global Industry Classification Standard (GICS) breaks it down into 11 main sectors: financials, technology, industrials, consumer discretionary, consumer staples, energy, materials, utilities, real estate, communication services, and health care.
Each sector responds differently to changes in interest rates, inflation, and consumer demand. For example, financials often perform well when rates rise, while technology tends to thrive when the economy is growing rapidly.
If you use a research tool like Stock Rover, you can screen and compare companies within and across sectors based on valuation, profitability, and growth. That kind of data-driven approach makes it easier to diversify and time your moves.
Cyclical Versus Defensive Sectors
Sectors usually fall into two main categories: cyclical and defensive. Cyclical sectors—like consumer discretionary, industrials, materials, and energy—move up and down with the business cycle. They tend to do best during economic expansions when demand and profits rise.
Defensive sectors—such as utilities, consumer staples, and health care—hold their value better when growth slows. These companies offer essential goods and services that people still need, even in a recession.
You can track performance ratios between cyclical and defensive ETFs to read market sentiment. Platforms like TradingView let you watch these trends in real time and spot early signs of rotation.
Global Industry Classification Standard
The GICS framework, built by MSCI and Standard & Poor’s, standardizes how companies are grouped by industry. It’s got four levels: sectors, industry groups, industries, and sub-industries. This setup keeps results consistent when comparing performance across markets and over time.
For example, inside the industrial sector, GICS splits aerospace firms from transportation and construction services. That extra detail helps you see which areas of the economy are really driving returns.
When building a diversified portfolio, use GICS classifications to balance exposure across cyclical and defensive sectors. Screening tools like TrendSpider can make this easier by automating chart analysis across multiple sectors.
Sector Rotation and the Economic Cycle
Sector rotation ties your investment decisions to the economy’s ups and downs. You watch how sectors react to changes in GDP growth, jobs, and consumer confidence, then adjust your holdings to fit each phase of the market cycle.
Expansion Phase and Leading Sectors
During expansion, GDP grows, employment rises, and consumer spending picks up—corporate profits usually climb. Investors often move toward cyclical sectors that benefit from all this activity.
Top performers here are technology, consumer discretionary, industrials, and financials. These sectors tend to outperform because businesses and consumers borrow, invest, and spend more. Earnings momentum and credit growth can confirm the trend.
You can monitor economic indicators such as PMI and retail sales to confirm the expansion is real. With a tool like Stock Rover, you can screen for companies in these sectors showing faster revenue and EPS growth.
As the expansion matures and valuations get stretched, consider trimming your exposure to high-beta sectors and start looking at more stable industries before the cycle peaks.
Peak and Late-Cycle Sectors
At the peak, economic growth slows, inflation creeps up, and interest rates usually sit at their highest. Corporate margins are squeezed as costs rise, prompting investors to shift to sectors that can maintain profits even as demand cools.
Energy, materials, and utilities often lead during this phase. Rising commodity prices and unflagging demand for basics help these sectors. Investors tend to like their steady cash flow and dividend yields when things get shaky.
Keep an eye on leading indicators like the yield curve and capacity utilization for hints that things are about to shift from expansion to slowdown. Tools like TrendSpider can help you spot technical signs—like resistance or momentum changes—that a sector’s run might be ending.
Rotating into late-cycle sectors gradually can help you hang onto your gains and cut down on risk as the economy cools.
Contraction and Defensive Plays
When the economy contracts or hits a recession, GDP drops, unemployment climbs, and consumer confidence takes a hit. Investors usually pull money out of cyclical sectors and move into defensive industries that keep earning even when times are tough.
Healthcare, consumer staples, and utilities often take the lead here since people still need their products. You can watch economic indicators like jobless claims and industrial production to gauge how deep the contraction goes.
Defensive positioning might mean picking dividend-paying stocks or sector ETFs that have shown lower volatility in the past. Seeking Alpha offers data-driven analysis on earnings resilience and dividend safety, so you can check which defensive names might help protect your capital.
When contraction drags on, focus more on liquidity and balance sheet strength than chasing growth.
Trough and Recovery Sectors
The trough marks the bottom of the economic cycle, usually after central banks or governments step in with support. Interest rates fall, credit conditions improve, and you start seeing green shoots in housing starts, manufacturing orders, and business sentiment.
Investors begin to rotate into financials, consumer discretionary, and technology as confidence slowly returns. These sectors benefit from new lending, more spending, and increased investment. Often, markets sniff out recovery before official GDP data does, so moving early can boost your returns.
With TradingView, you can track which sector ETFs are breaking above long-term resistance, signaling new momentum.
As recovery builds, you gradually shift back toward cyclical growth sectors, positioning your portfolio for the next expansion. At the same time, keep enough diversification to help manage risk.
Implementing Sector Rotation Strategies
Your success with sector rotation really depends on how you read macro trends, interpret financial data, and stick to disciplined portfolio management. Linking broad economic signals to your sector exposures—and rebalancing regularly—helps you make better investment decisions.
Top-Down Versus Bottom-Up Approaches
With a top-down approach, you start by looking at the economy. You check interest rates, inflation, and GDP growth to spot which sectors usually benefit at each stage. For instance, technology and consumer discretionary often lead in early expansions, while utilities and healthcare hold up better during slowdowns.
A bottom-up approach zooms in on individual companies within sectors. You look at earnings growth, valuation ratios, and competitive advantages before deciding where to move your money. This suits investors who like digging into company details more than macro trends.
A lot of people mix both. You might use a top-down filter to find promising sectors, then run bottom-up research with tools like Stock Rover to screen for the strongest stocks in those sectors. The idea is to match big-picture trends with solid fundamentals, not just chase whatever’s moving today.
Using Economic Indicators for Timing
Timing really matters, since sectors almost never move in lockstep. You’ll want to track leading indicators—manufacturing indexes, consumer confidence, yield curves—to get ahead of shifts. When these improve, cyclical sectors like industrials and financials tend to pick up steam.
Lagging indicators like unemployment and inflation confirm trends, but they move more slowly. Use them to double-check, not to kick off, your rotations. And coincident indicators—think retail sales—let you get a sense of what’s happening right now so you can tweak your exposure.
Keep a running watchlist of the most relevant metrics and update it monthly. Charting tools like TradingView let you overlay sector ETFs right on top of indicators, so you can see correlations at a glance.
Don’t get caught reacting to a single data point. Wait for consistent patterns across multiple reports before you change allocations.
Portfolio Diversification and Rebalancing
Diversification is your shield against overexposure to a single sector. You might allocate a core chunk of your portfolio—usually 70–80%—to broad market or index ETFs and then rotate the last 20–30% among sectors with relative strength. That way, you balance stability with the ability to move tactically.
Regular portfolio rebalancing keeps your sector weights on target. Quarterly or semiannual reviews usually do the trick. Rebalancing helps you avoid drift from market swings and keeps you disciplined.
Use a simple table to track your sector exposure:
| Sector | Target % | Current % | Action |
|---|---|---|---|
| Technology | 15 | 22 | Trim |
| Healthcare | 10 | 8 | Add |
| Utilities | 5 | 4 | Hold |
Document each change and your reasoning every cycle. Over time, this systematic approach tightens up your active management and risk control.
Tools and Vehicles for Sector Rotation
You’ve got sector-based funds, market data, and analysis tools to spot where money’s moving across industries. The goal? Measure strength, momentum, and capital flow so you can adjust positions quickly and with evidence.
Sector ETFs and Mutual Funds
Exchange-traded funds (ETFs) and mutual funds give you diversified exposure to specific industries—no need to pick individual stocks. Sector ETFs, especially ones tracking S&P 500 sectors, trade intraday like stocks and usually cost less than mutual funds.
Mutual funds trade just once daily and often bring active management. They might fit investors who want professional oversight or plan to hold longer. ETFs let you react faster to sector or macro shifts.
Compare liquidity, expense ratio, and tracking error before you settle on a fund. Tools like Stock Rover let you screen ETFs by performance, volatility, and correlation to benchmarks.
Use these metrics to check if your sector rotation strategy matches your risk tolerance and timing preferences.
Technical Analysis Tools
Technical analysis tools help you catch momentum shifts between sectors. You’ll see Relative Strength (RS), Rate of Change (ROC), and moving averages used a lot—these show which sectors are leading or lagging the market.
Platforms like TrendSpider can automate trendline detection, backtest sector signals, and let you compare multiple ETFs side by side. That makes it easier to spot when cyclical sectors start picking up or when defensive ones take charge.
Set clear entry and exit rules. For example, rotate into sectors when their RS line crosses above a moving average or shows positive ROC over a set time. Don’t lean too heavily on one indicator—always confirm with price-volume patterns and macro data.
Tracking Sector Fund Flows
Fund flow data tells you where investors are putting new money. If you see rising inflows to a sector ETF, that usually means confidence is building; outflows suggest folks are rotating out. Track flows daily or weekly to catch sentiment shifts early.
Sites like Seeking Alpha publish fund flow summaries and sector allocation trends. Combine this info with performance metrics to see if money movement lines up with price strength.
Focus on net flows, not just raw volume. Consistent inflows over a few weeks usually signal real rotation, not just a one-off spike. Use flow data to confirm, not predict, before you shift your portfolio.
Risk Management and Practical Considerations
You manage risk in sector rotation by controlling position size, setting disciplined exit points, and factoring in trading costs and liquidity. Every choice affects stability, especially if the market or economy changes faster than you expected.
Position Sizing and Stop-Losses
Position sizing decides how much capital you put into each sector. Stick to a clear rule—like risking no more than 1–2% of total capital per trade—so losses stay manageable if a rotation call flops. For volatile sectors, smaller positions help you avoid nasty drawdowns.
Use stop-loss levels to stay disciplined. Set stops based on volatility or recent price swings to exit before losses get out of hand. A 10% trailing stop can lock in gains in cyclical sectors without cutting winners too soon.
Tools like TrendSpider can automate stops and backtest different exit strategies. Review how those stops perform in different markets—expansion, slowdown, or recovery—to fine-tune your approach.
Transaction Costs and Liquidity
Frequent sector rotation chips away at returns if you ignore transaction costs—commissions, bid-ask spreads, taxes. Costs shoot up if you trade illiquid sector ETFs or small-caps, especially when volatility widens spreads.
Before you trade, check average daily volume and slippage estimates. Avoid sectors with thin liquidity during economic uncertainty, when spreads can double. Here’s a quick cost comparison:
| Sector ETF | Avg. Spread | Daily Volume | Typical Cost Impact |
|---|---|---|---|
| Large-Cap Tech | 0.02% | High | Low |
| Small-Cap Energy | 0.12% | Moderate | Medium |
| Emerging Markets | 0.25% | Low | High |
Platforms like Stock Rover help you check liquidity and trading efficiency before you rotate.
Common Pitfalls and Limits
Sector rotation falls apart when people treat it like market timing instead of sticking to a disciplined allocation. If you overreact to short-term headlines or misread the economic environment, you’ll likely move too early.
Another trap is ignoring sector correlations. Rotating into several sectors that move together just piles on risk without real diversification. Always check historical correlations before reallocating.
And honestly, even the best models hit limits. Policy surprises, earnings shocks, or geopolitical events can mess up rotation patterns. Keep some cash or defensive positions handy, and reassess your strategy every quarter to stay on track.
Frequently Asked Questions
Sector rotation means shifting your investments among industries as economic and market conditions change. You use it to manage risk, find growth, and match your portfolio to the business cycle. Timing, good data, and discipline all shape how well it works.
What is sector rotation, and how can it impact your investment strategy?
Sector rotation means moving capital from one industry group to another, depending on where the economy is in its cycle. For example, investors often move from technology and consumer discretionary stocks into utilities and healthcare when growth slows. This approach can help stabilize returns and cut down drawdowns when the market shifts.
How do you identify which sector to invest in at a given time?
You look at macro signals—GDP growth, interest rates, inflation trends. Rising rates tend to favor financials and energy, while easier conditions can boost tech or consumer goods. Tools like Stock Rover help you screen for sectors with better earnings revisions and strong relative strength.
What are the risks associated with sector rotation in portfolio management?
The big risk is mistiming the cycle. Economic data often lags, and markets usually move ahead of the reports. Overtrading racks up transaction costs and taxes. Balance tactical moves with a core, long-term allocation to avoid churning your portfolio too much.
Can sector rotation enhance your portfolio’s performance over the long term?
Yes, if you stick to consistent rules and use solid data. Rotating into sectors with improving fundamentals can boost risk-adjusted returns. But you’ve got to analyze carefully and stay disciplined—move too late or too often, and you’ll eat into your gains.
What indicators signal a potential sector shift in the market?
Watch leading indicators like yield curve changes, manufacturing data, and consumer confidence. Confirm with price momentum and relative strength charts. Platforms like TrendSpider automate chart scans to spot early signs of sector leadership changes.
How frequently should you review and adjust your positions for effective sector rotation?
You’ll probably want to check your sector weightings every quarter, or whenever a big economic report shifts the outlook. If you’re more of an active trader, you might prefer shorter review cycles, but that does mean you’ll need to keep a close eye on things—and watch your costs.
Source link