Shopify stock soared 48% in just ONE month! Could this be your golden investment opportunity? ✨
Shopify has emerged as a global leader in the e-commerce space, showcasing an impressive track record of growth and innovation. Handling nearly $950 billion in transactions across 175 countries, Shopify facilitates more online sales than industry giants like eBay, Target, The Home Depot, and Best Buy combined. Its significant market presence and rapid growth make Shopify a vital stock for investors to monitor.
Shopify’s Strong Financial Trajectory
Exceptional Revenue Growth
Over the past five years, Shopify has demonstrated remarkable financial performance, achieving a compound annual revenue growth rate exceeding 40%. This robust expansion underscores the company’s ability to capture a growing share of the e-commerce market.
Q3 2024 Financial Highlights
On November 12, 2024, Shopify reported its Q3 results, sparking widespread investor enthusiasm. Key highlights included:
- Revenue Growth: A 26% year-over-year increase to $2.16 billion, marking the sixth consecutive quarter of over 25% revenue growth.
- Gross Merchandise Volume (GMV): A 24% increase to nearly $70 billion.
- Profitability: Free cash flowThe cash flow statement provides a detailed overview of the cash inflows and outflows of a company over a specified period of time. It includes cash received from operations, inves… margin expanded to 19%, signaling improved operational efficiency and profitability.
These financial results highlight Shopify’s resilience and ability to scale, even in a competitive market landscape.
Black Friday Performance: A Testament to Resilience
On November 30, Shopify reported stellar Black Friday sales, with GMV reaching $5 billion—an impressive 22% increase from 2023. This strong performance aligns with Shopify’s Q4 GMV expectations of $92.8 billion, showcasing its ability to capitalize on peak shopping seasons. The success during Black Friday further validates the platform’s value proposition for merchants and its growing appeal to consumers.
Market Share Expansion: A Strategic Shift
Shopify’s recent strategic focus on attracting larger online sellers has paid dividends, enabling it to gain market share from competitors like Salesforce. This shift is expected to generate significant additional revenue streams and bolster the company’s long-term growth potential. By expanding its market presence, Shopify has positioned itself as an essential partner for businesses seeking scalable e-commerce solutions.
Analyst Upgrades Drive Confidence
The combination of strong Q3 results and Black Friday performance led to multiple Wall Street analysts raising their price targets for Shopify stock. These upgrades reflect increased confidence in the company’s growth trajectory and profitability. As a result, Shopify experienced heightened investor interest, further driving its stock price upward.
Market Sentiment Fuels Momentum
The broader equity markets have experienced a risk-on sentiment since early November 2024, which has also benefited Shopify. Outperforming the broader tech sector, Shopify has seen a remarkable 48% rise in its stock price during November alone. This upward momentum reflects both the company’s strong fundamentals and favorable market conditions.
Shopify Stock Trading Plan
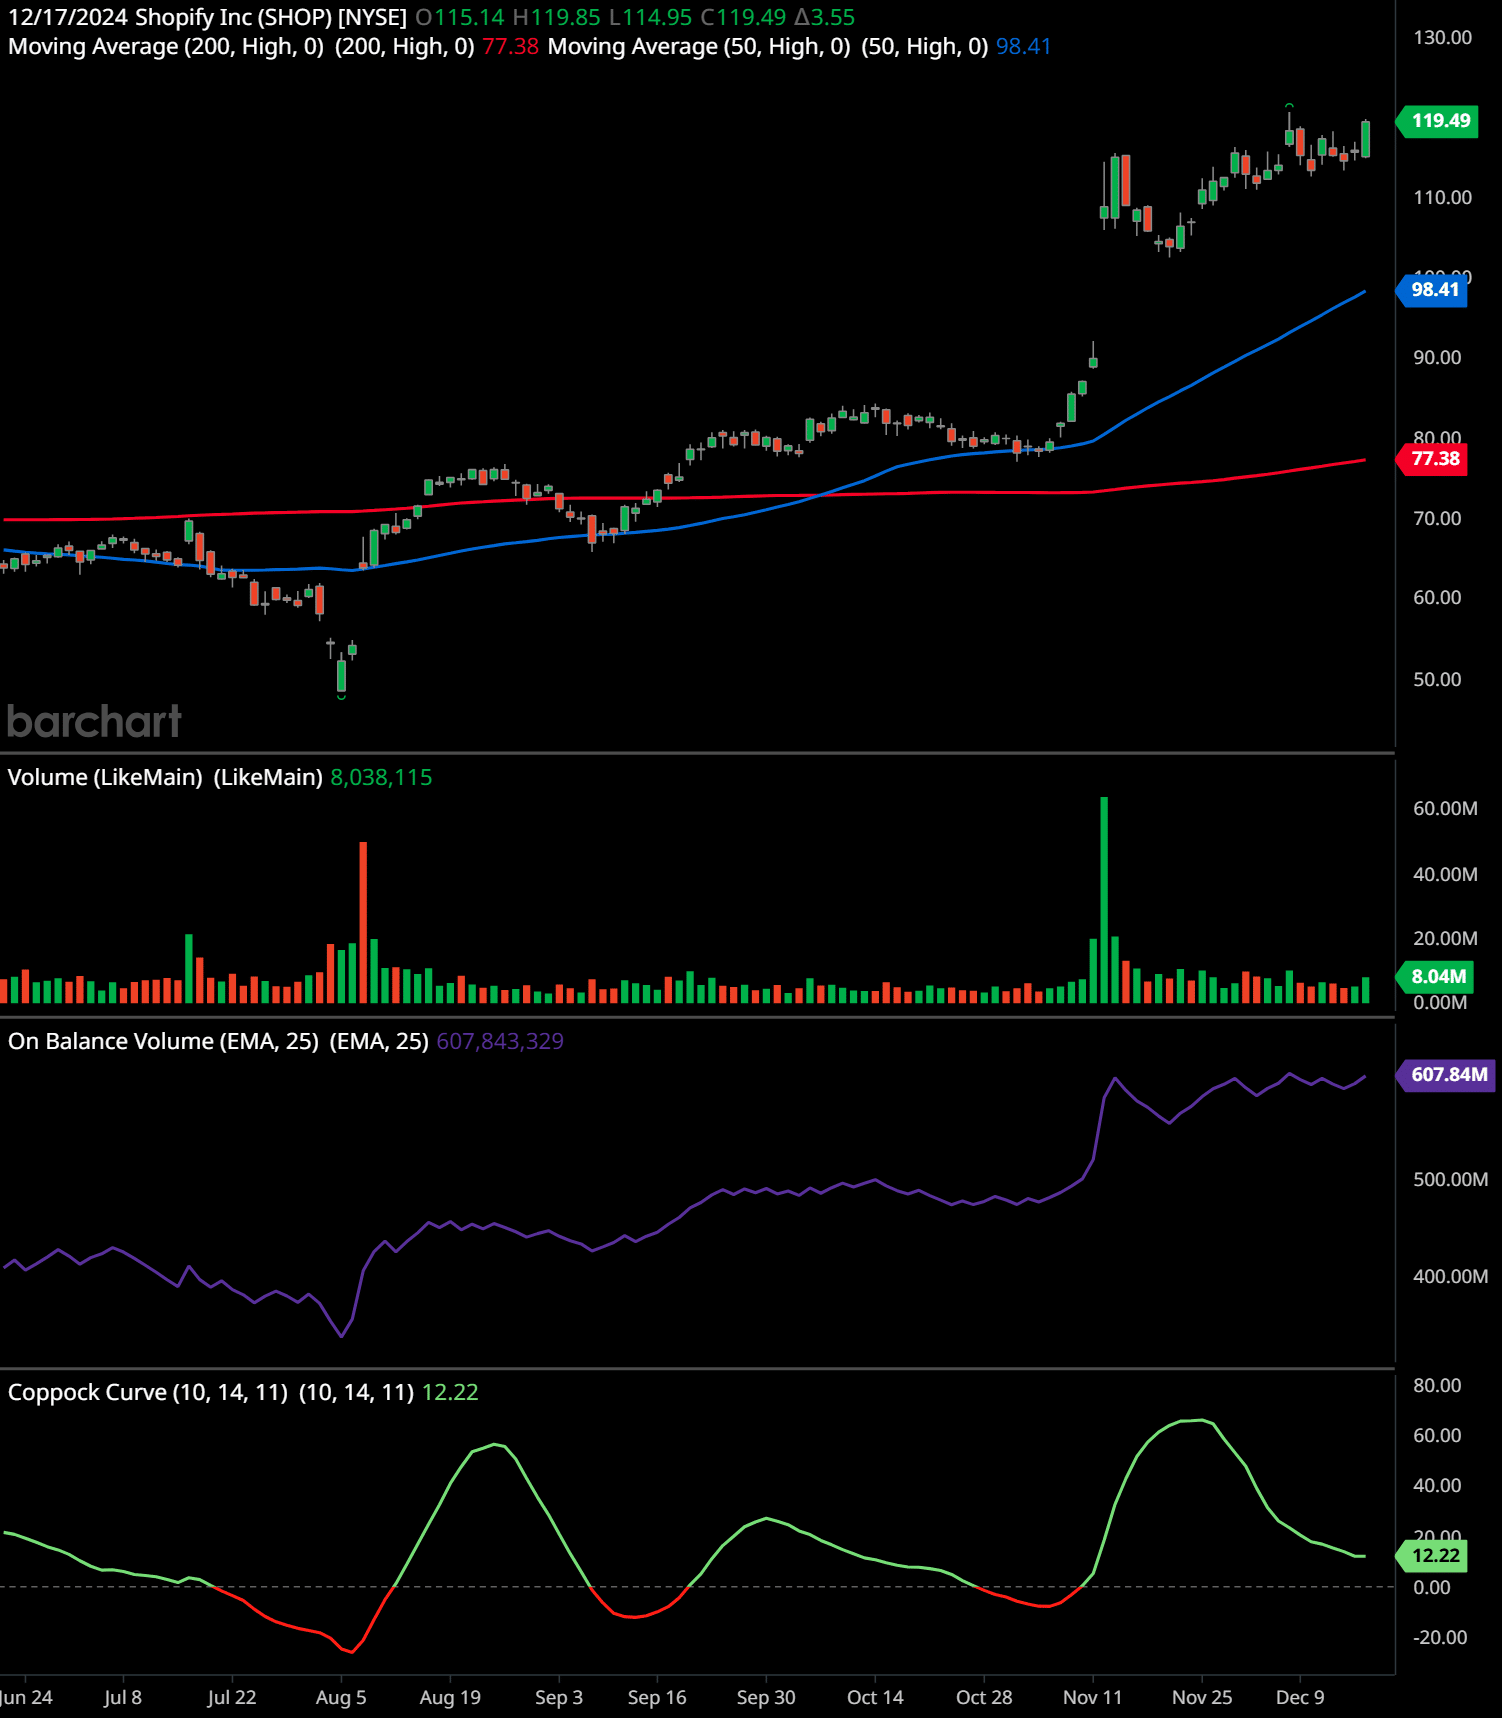
This chart of Shopify Inc. (SHOP) displays a strong uptrend on the daily timeframe, supported by key technical indicators and moving averagesThe concept of moving averages dates back to the early 20th century. While it is challenging to attribute the invention of moving averages to a single individual, W. P. Hamilton, a….
1. Key Observations and Trend Analysis:
- The stock price is trading well above the 50-day moving averageThe concept of moving averages dates back to the early 20th century. While it is challenging to attribute the invention of moving averages to a single individual, W. P. Hamilton, a… (98.41) and the 200-day moving averageThe concept of moving averages dates back to the early 20th century. While it is challenging to attribute the invention of moving averages to a single individual, W. P. Hamilton, a… (77.38). This signifies a strong bullish trend.
- Price has made a significant move from mid-September, confirming a sustained uptrend with a series of higher highs and higher lows.
- Resistance is currently forming around the $120 level, as shown by recent price action where candles are consolidating near this zone.
- Support is at the $98.41 (50-day MA) and stronger support is seen near the $77.38 (200-day MA), reflecting past accumulation and buying zones.
2. Volume and On-Balance VolumeThe On Balance Volume indicator (OBV) is a technical analysis tool used to measure the flow of money into and out of a security over a specified period of time. It is a cumulative … (OBVThe On Balance Volume indicator (OBV) is a technical analysis tool used to measure the flow of money into and out of a security over a specified period of time. It is a cumulative …):
- Volume spikes in early November and December coincide with large bullish moves, indicating strong institutional buying.
- On-Balance VolumeThe On Balance Volume indicator (OBV) is a technical analysis tool used to measure the flow of money into and out of a security over a specified period of time. It is a cumulative … (OBVThe On Balance Volume indicator (OBV) is a technical analysis tool used to measure the flow of money into and out of a security over a specified period of time. It is a cumulative …) is trending upward, reflecting increasing buying pressure. A rising OBVThe On Balance Volume indicator (OBV) is a technical analysis tool used to measure the flow of money into and out of a security over a specified period of time. It is a cumulative … confirms the sustainability of the current uptrend.
3. Coppock CurveThe Coppock Curve is a technical analysis tool that has been used by investors for decades to identify major market bottoms and assess long-term trends. Named after Edwin Sedgwick …:
- The Coppock CurveThe Coppock Curve is a technical analysis tool that has been used by investors for decades to identify major market bottoms and assess long-term trends. Named after Edwin Sedgwick … currently sits at 12.22, suggesting continued bullish momentum.
- However, the curve has recently shown a slight downward turn. Traders should watch for any potential crossover below zero, which could signal weakness.
4. Future Price Trends and Forecast:
- With strong momentum, Shopify’s stock price is likely to test and potentially break the $120 resistance level.
- A clean breakoutBreakout patterns occur when a stock price moves beyond a defined level of support or resistance with increased volume, signaling the potential start of a new trend. A breakout ind… above $120 could send the stock to new highs, targeting $130 as the next psychological resistance.
- On the downside, any retracement may find buyers near $98-$100, the zone near the 50-day MA.
5. Chart Patterns:
- The stock is forming a bullish continuation pattern with recent consolidation near highs, suggesting that bulls are holding gains and preparing for the next leg higher.
- The price action also resembles a rounded bottom breakoutBreakout patterns occur when a stock price moves beyond a defined level of support or resistance with increased volume, signaling the potential start of a new trend. A breakout ind… that started in August, leading to the strong uptrend seen today.
Trading Plans:
Swing Trading Plan:
- Entry: Buy on a breakoutBreakout patterns occur when a stock price moves beyond a defined level of support or resistance with increased volume, signaling the potential start of a new trend. A breakout ind… above $120 with confirmation on volume. Alternatively, buy near the 50-day MA ($98) if the stock pulls back.
- Stop Loss: $115 for breakoutBreakout patterns occur when a stock price moves beyond a defined level of support or resistance with increased volume, signaling the potential start of a new trend. A breakout ind… trades; $95 for pullback trades.
- Target: Short-term target is $130, with trailing stop losses to lock in gains.
Long-Term Trading Plan:
- Entry: Accumulate shares during retracements near the 50-day MA ($98) or the 200-day MA ($77).
- Stop Loss: $70 (below the 200-day MA as a long-term support).
- Target: Long-term price target is $150+ over the next 12-18 months, assuming continued fundamental and technical strength.
The chart reflects strong bullish momentum, with moving averagesThe concept of moving averages dates back to the early 20th century. While it is challenging to attribute the invention of moving averages to a single individual, W. P. Hamilton, a…, OBVThe On Balance Volume indicator (OBV) is a technical analysis tool used to measure the flow of money into and out of a security over a specified period of time. It is a cumulative …, and the Coppock CurveThe Coppock Curve is a technical analysis tool that has been used by investors for decades to identify major market bottoms and assess long-term trends. Named after Edwin Sedgwick … favoring an upward bias. However, resistance near $120 could pose short-term hurdles. Traders should watch for volume confirmation on any breakoutBreakout patterns occur when a stock price moves beyond a defined level of support or resistance with increased volume, signaling the potential start of a new trend. A breakout ind….
Past performance is not an indication of future results. This analysis is for informational purposes only and should not be considered investment advice. Always conduct your own research and consider consulting with a financial advisor before making any investment decisions. 🧡
Why Shopify Matters to Investors
Shopify’s leadership in the e-commerce space and its consistent financial performance make it a critical company for investors to follow. Its ability to innovate, capture market share, and deliver strong revenue growth demonstrates its potential for long-term profitability. Moreover, Shopify’s recent stock rebound, despite trading 35% below its peak, presents an attractive opportunity for investors seeking exposure to the thriving e-commerce sector.
With a proven track record of growth, strategic market expansion, and strong financial fundamentals, Shopify remains a compelling investment opportunity for those looking to capitalize on the continued evolution of online commerce.
Do you have a news tip for GuerillaStockTrading? Please email us at
[email protected]
💥 GET OUR LATEST CONTENT IN YOUR RSS FEED READER
We are entirely supported by readers like you. Thank you.🧡
At GuerillaStockTrading, we maintain full transparency and impartiality; we never blog about stocks or crypto in which we hold a personal position unless explicitly stated in the article. Additionally, we do not accept paid promotions presented as content. All information shared is for informational purposes only and should not be construed as financial, investment, tax, or legal advice, nor as a recommendation to buy any security or financial asset. The content is general in nature and does not account for individual circumstances. It may not be suitable for your particular situation. Before making financial decisions, you are encouraged to seek guidance from your own financial or investment advisor.