Speculator Extremes: Soybean Oil, Bitcoin & AUD lead weekly Bullish Positions
By InvestMacro
The latest update for the weekly Commitment of Traders (COT) report was released by the Commodity Futures Trading Commission (CFTC) on Friday for data ending on Tuesday April 7th.
This weekly Extreme Positions report highlights the Most Bullish and Most Bearish Positions for the speculator category and is a current snapshot of how speculators were positioned as of Tuesday. Extreme positioning in these markets can foreshadow strong moves in the underlying market.
To signify an extreme position, we use the Strength Index (also known as the COT Index) of each instrument, a common method of measuring COT data. The Strength Index is simply a comparison of current trader positions against the range of positions over the previous 3 years. We use over 80 percent as extremely bullish and under 20 percent as extremely bearish (Compare Strength Index scores across all markets in the data table or cot leaders table).
The 6-WK Trend score is the change in the Strength Index over the past 6 weeks and signals how strong and which way the Strength Index is going.
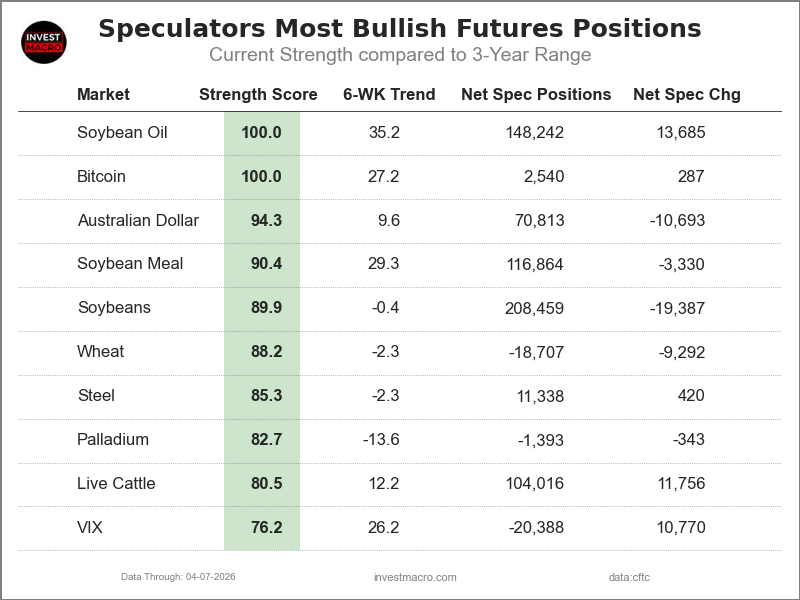
Here Are This Week’s Most Bullish Speculator Positions:
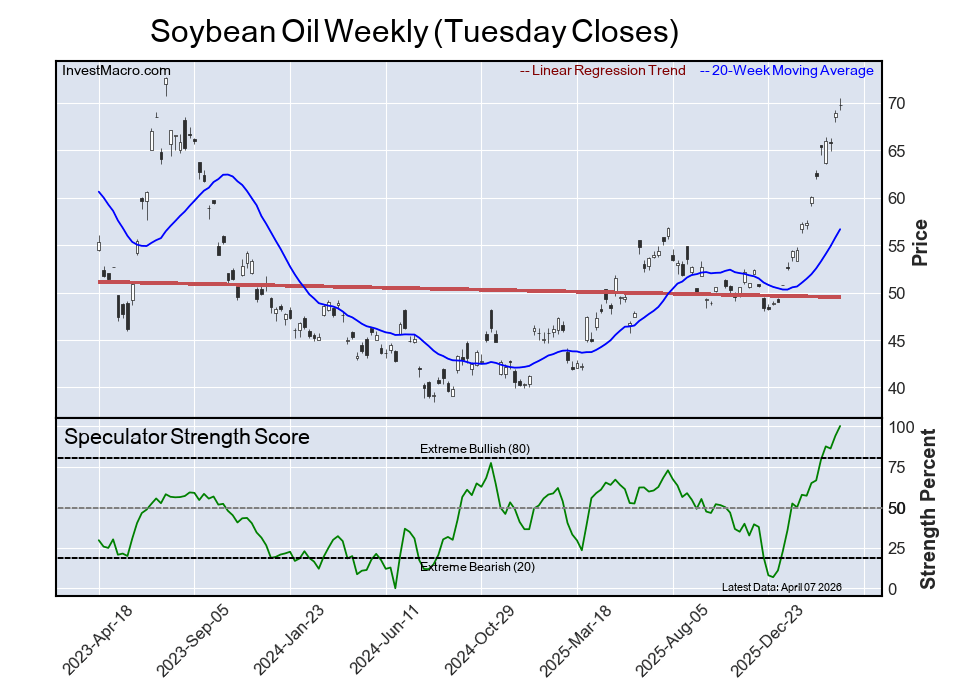
Soybean Oil
The Soybean Oil speculator position comes in tied at the top of the most bullish extreme standing this week as the Soybean Oil speculator level is currently at a 100 percent score of its 3-year range.
The six-week trend for the percent strength score totaled a boost by 35 percentage points this week. The overall net speculator position was a total of 148,242 net contracts this week with a gain of 13,685 contract in the weekly speculator bets.
Speculators or Non-Commercials Notes:
Speculators, classified as non-commercial traders by the CFTC, are made up of large commodity funds, hedge funds and other significant for-profit participants. The Specs are generally regarded as trend-followers in their behavior towards price action – net speculator bets and prices tend to go in the same directions. These traders often look to buy when prices are rising and sell when prices are falling. To illustrate this point, many times speculator contracts can be found at their most extremes (bullish or bearish) when prices are also close to their highest or lowest levels.
These extreme levels can be dangerous for the large speculators as the trade is most crowded, there is less trading ammunition still sitting on the sidelines to push the trend further and prices have moved a significant distance. When the trend becomes exhausted, some speculators take profits while others look to also exit positions when prices fail to continue in the same direction. This process usually plays out over many months to years and can ultimately create a reverse effect where prices start to fall and speculators start a process of selling when prices are falling.
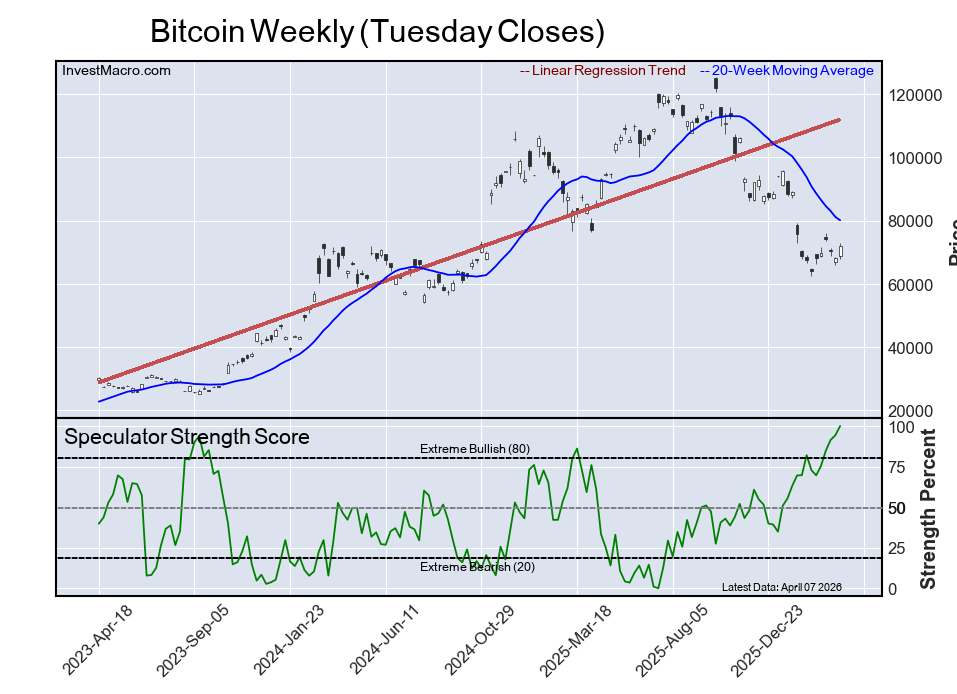
Bitcoin
The Bitcoin speculator position comes in next and also tied at the top of the extreme standings this week. The Bitcoin speculator level is now at a 100 percent score of its 3-year range.
The six-week trend for the percent strength score was a rise of 27 percentage points this week while the speculator position registered 2,540 net contracts this week with a weekly increase of 287 contracts in speculator bets.
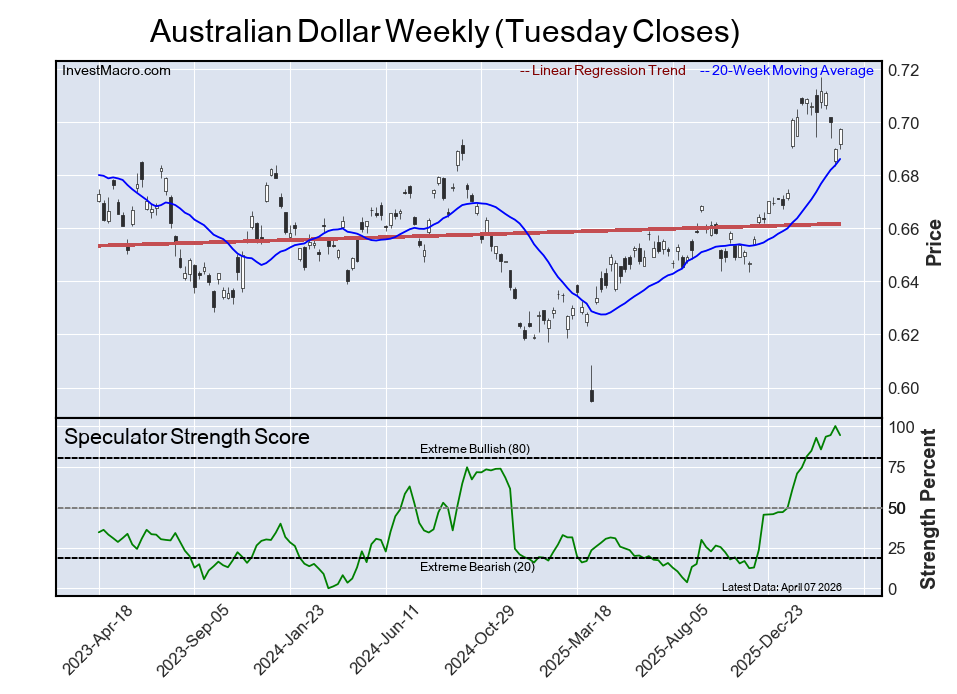
Australian Dollar
The Australian Dollar speculator position has cooled off lately and comes in third this week in the extreme standings. The AUD speculator level now resides at a 94 percent score of its 3-year range.
The six-week trend for the speculator strength score came in at an increase by 10 percentage points this week. The overall speculator position was 70,813 net contracts this week with a drop of -10,693 contracts in the weekly speculator bets.
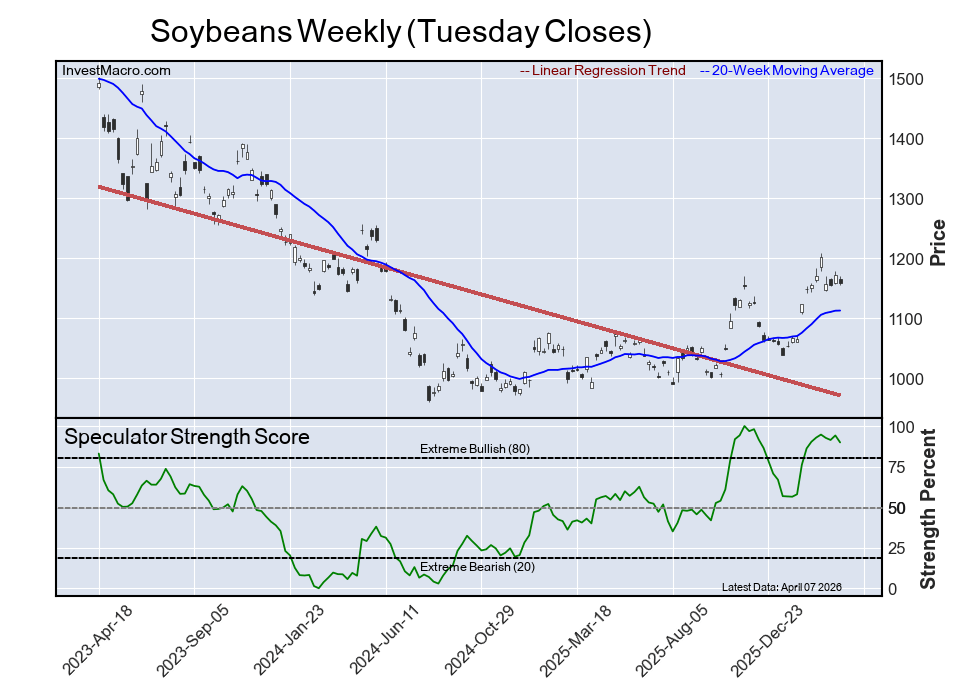
Soybeans
The Soybeans speculator position comes up number four in the extreme standings this week. The Soybeans speculator level is at a 90 percent score of its 3-year range.
The six-week trend for the speculator strength score saw no change this week while the overall speculator position was 208,459 net contracts this week with a drop of -19,387 contracts in the speculator bets.
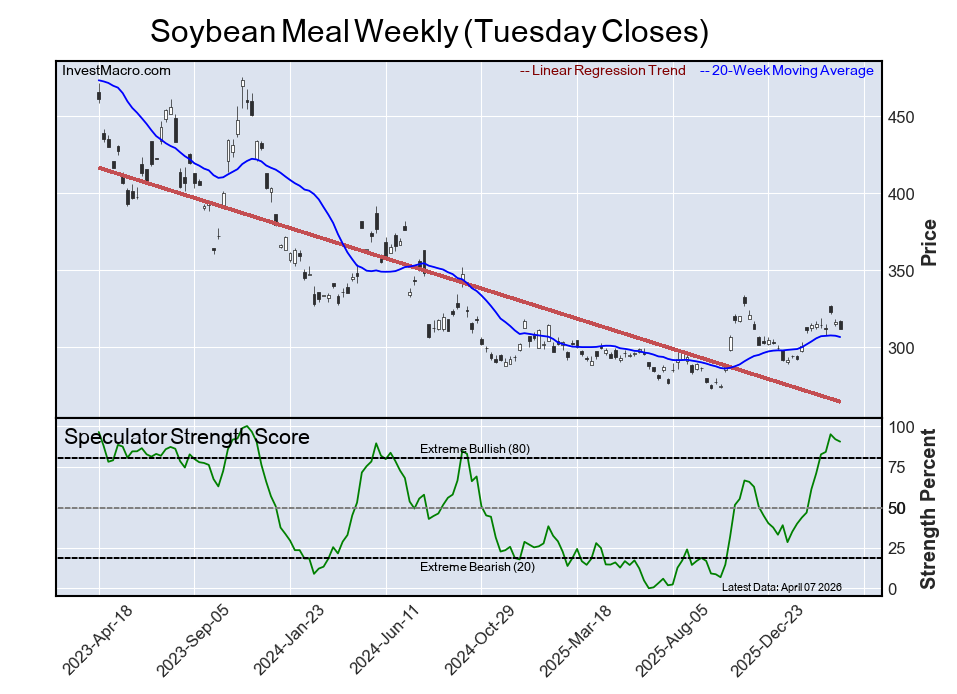
Soybean Meal
The Soybean Meal speculator position rounds out the top five in this week’s bullish extreme standings. The Soybean Meal speculator level sits at a 90 percent score of its 3-year range. The six-week trend for the speculator strength score was a strong gain of 29 percentage points this week.
The speculator position was 116,864 net contracts this week with a small dip of -3,330 contracts in the weekly speculator bets.
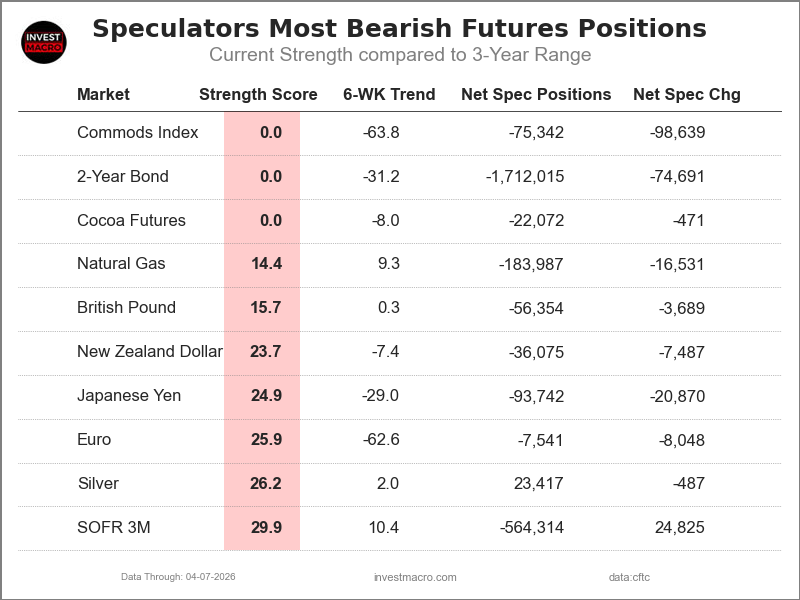
The Most Bearish Speculator Positions of the Week:
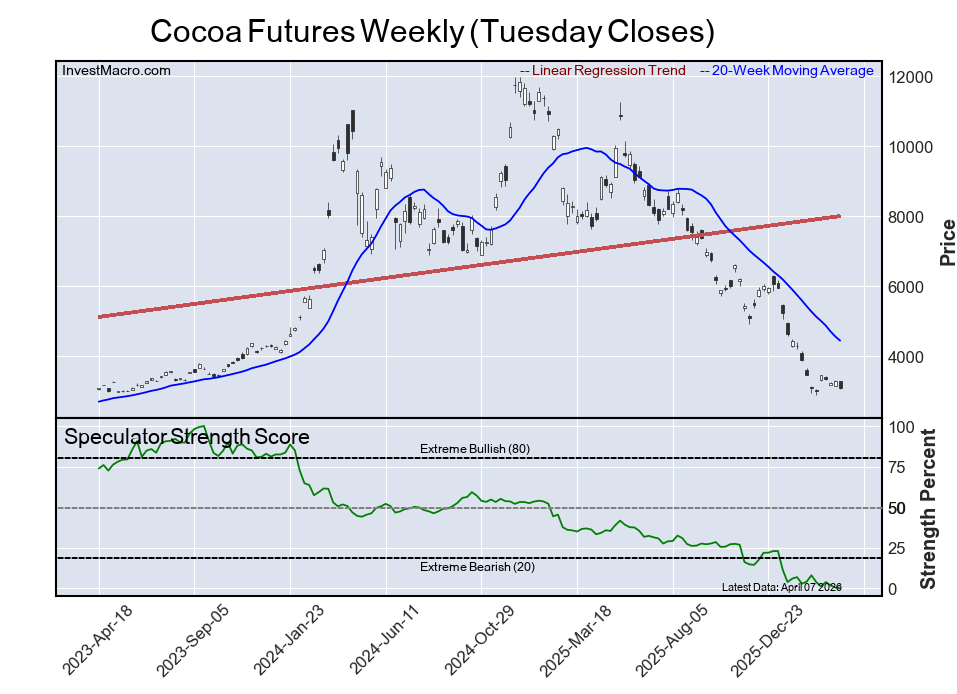
Cocoa Futures
The Cocoa Futures speculator position comes in as the most bearish extreme standing this week as the Cocoa speculator level is at a 0 percent score of its 3-year range.
The six-week trend for the speculator strength score was a decline by -8 percentage points this week while the overall speculator position was -22,072 net contracts this week with a dip of -471 contracts in the speculator bets.
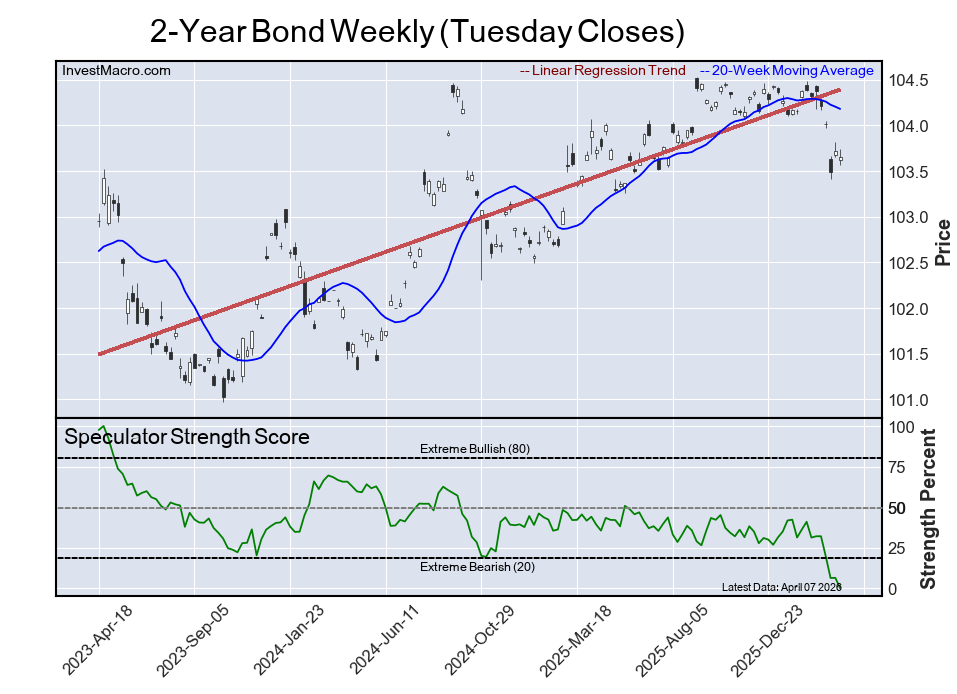
2-Year Bond
The 2-Year Bond speculator position continues to see very weak sentiment and comes in next for the most bearish extreme standing on the week. The 2-Year speculator level is at a 0 percent score of its 3-year range.
The six-week trend for the speculator strength score was a drop by -31 percentage points this week and the speculator position was -1,712,015 net contracts this week with a decline of -74,691 contracts in the weekly speculator bets.
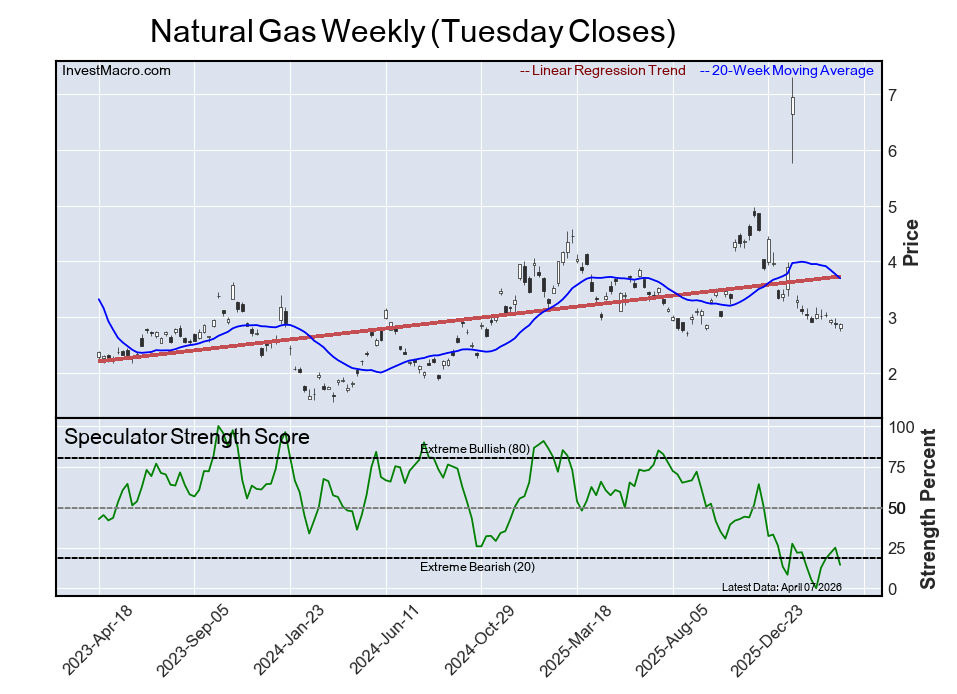
Natural Gas
The Natural Gas speculator position comes in as third most bearish extreme standing of the week. The Natural Gas speculator level now resides at a 14 percent score of its 3-year range.
The six-week trend for the speculator strength score was a rise by 9 percentage points this week. The overall speculator position was -183,987 net contracts this week with a reduction of -16,531 contracts in the speculator bets.
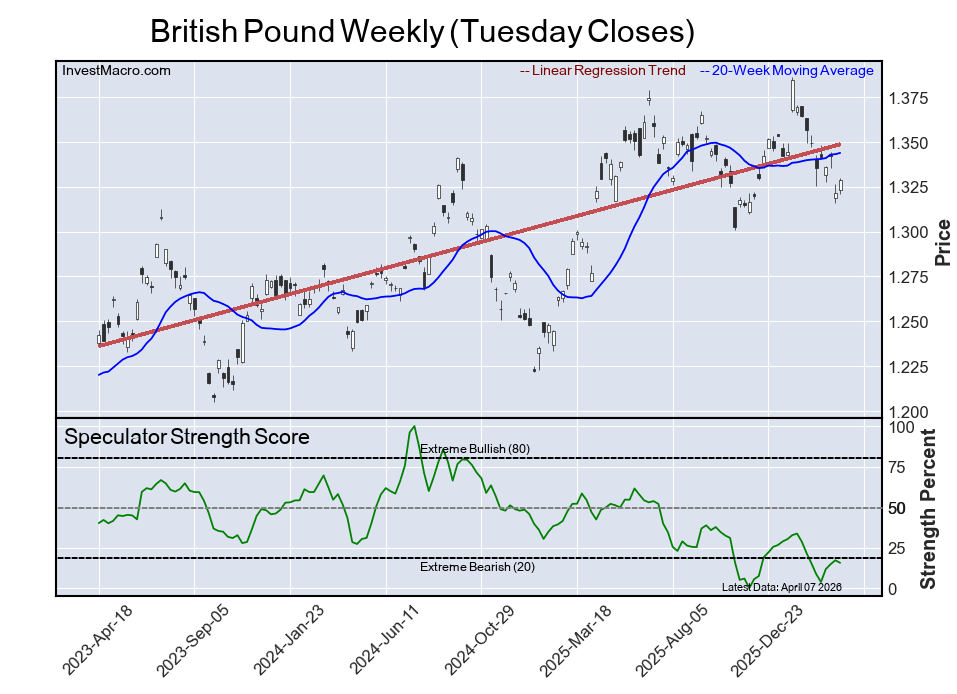
British Pound
The British Pound speculator position comes in as this week’s fourth most bearish extreme standing as the GBP speculator level is at a 16 percent score of its 3-year range.
The six-week trend for the speculator strength score showed no change this week as the speculator position was -56,354 net contracts this week with a shortfall of -3,689 contracts in the weekly speculator bets.
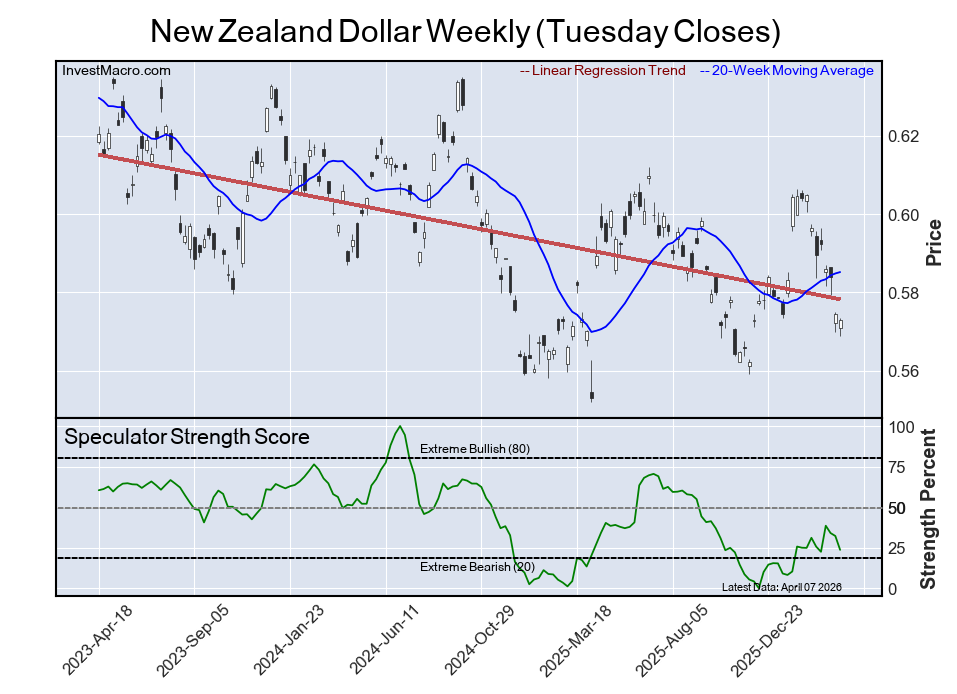
New Zealand Dollar
The New Zealand Dollar speculator position comes in as the fifth most bearish extreme standing for this week with the NZD speculator level sitting at a 24 percent score of its 3-year range.
The six-week trend for the speculator strength score was a decline by -7 percentage points this week and the speculator position was -36,075 net contracts this week with a decline of -7,487 contracts in the weekly speculator bets.
Article By InvestMacro – Receive our weekly COT Newsletter
*COT Report: The COT data, released weekly to the public each Friday, is updated through the most recent Tuesday (data is 3 days old) and shows a quick view of how large speculators or non-commercials (for-profit traders) were positioned in the futures markets.
The CFTC categorizes trader positions according to commercial hedgers (traders who use futures contracts for hedging as part of the business), non-commercials (large traders who speculate to realize trading profits) and nonreportable traders (usually small traders/speculators) as well as their open interest (contracts open in the market at time of reporting). See CFTC criteria here.

- COT Metals Charts: Speculator Platinum Bets rise for 7th out of last 8 weeks Apr 12, 2026
- COT Bonds Charts: Weekly Speculator Changes led by 5-Year Bonds Apr 12, 2026
- COT Energy Charts: Weekly Speculator Bets led by Brent Oil Apr 12, 2026
- COT Soft Commodities Charts: Speculator Bets led by Soybean Oil, Cotton & Live Cattle Apr 12, 2026
- Lithium Developer Lands Spot in US-Japan Critical Minerals Partnership Apr 10, 2026
- Oil prices have once again approached 100 dollars per barrel Apr 10, 2026
- USD/JPY: Yen Fared Better, but Energy Rally Not Over Apr 10, 2026
- Stock indices surged sharply amid the 14‑day ceasefire in the Middle East Apr 9, 2026
- EUR/USD on the Plus Side: Middle East Truce Proves Fragile Apr 9, 2026
- Iran and the United States have signed a 14‑day ceasefire: risk appetite has returned to the markets Apr 8, 2026
Source link