Stock Consolidation Strategies: When To Buy, Sell, Or Hold | Trading Strategy Guides
Stock consolidation happens when a stock moves sideways without setting a clear direction. Consolidated stocks usually trade within a set price range and lack strong momentum—making it hard for stock traders to find trading opportunities, even with advanced trading tools and analysis.
Many investors see these consolidation phases as uncertain and unpredictable, questioning themselves whether to buy, sell or hold their positions while the price action remains confined to a tight trading range.
If you track stock charts regularly, you will notice that sometimes, after a sharp rally that pushes prices too high too fast, the trend slows down and trading becomes range-bound. This is not an unusual scenario; it occurs when traders hesitate to push prices further. In financial terms, this is referred to as a period of stock consolidation.
Understanding Stock Consolidation
The duration of these consolidation phases can vary significantly across different timeframes, with some stocks moving sideways for days while others remain range-bound for extended periods. Traders rely on support and resistance zones to gauge when prices might break out or fall. A breakout can be triggered by major news, earnings reports, or large institutional trades.
For investors and traders of all experience levels, determining the right course of action during stock consolidation periods requires careful analysis. Therefore, this guide will explore 5 critical trading aspects:
- How to know when a stock is consolidating
- Key technical indicators to identify stock consolidation
- When to buy in a consolidation phase
- When to sell during consolidation
- When to hold and wait in consolidation
See below…
How to Know When a Stock is Consolidating
Recognizing a stock in consolidation requires observing three key characteristics that must appear together on your technical analysis charts.
- The most noticeable indicator is the formation of consistent price boundaries, creating what technical analysts often refer to as a horizontal channel pattern.
- These price movements typically compress into a tight consolidation zone, though remember that what constitutes “tight” varies significantly among different stocks and market conditions.
- An equally important signal is the notable decrease in trading activity, with volume bars showing consistently lower levels without significant spikes.
Stock consolidation periods can lead to either bullish or bearish outcomes depending on market conditions. Experienced traders often view these phases as preparation grounds, allowing the market to build energy before the next significant price move or trading breakout develops.
Now, lets see what is the best indicator to identify consolidation.
See below…
Key Technical Indicators to Identify Stock Consolidation
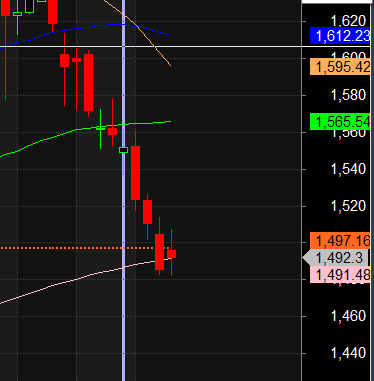
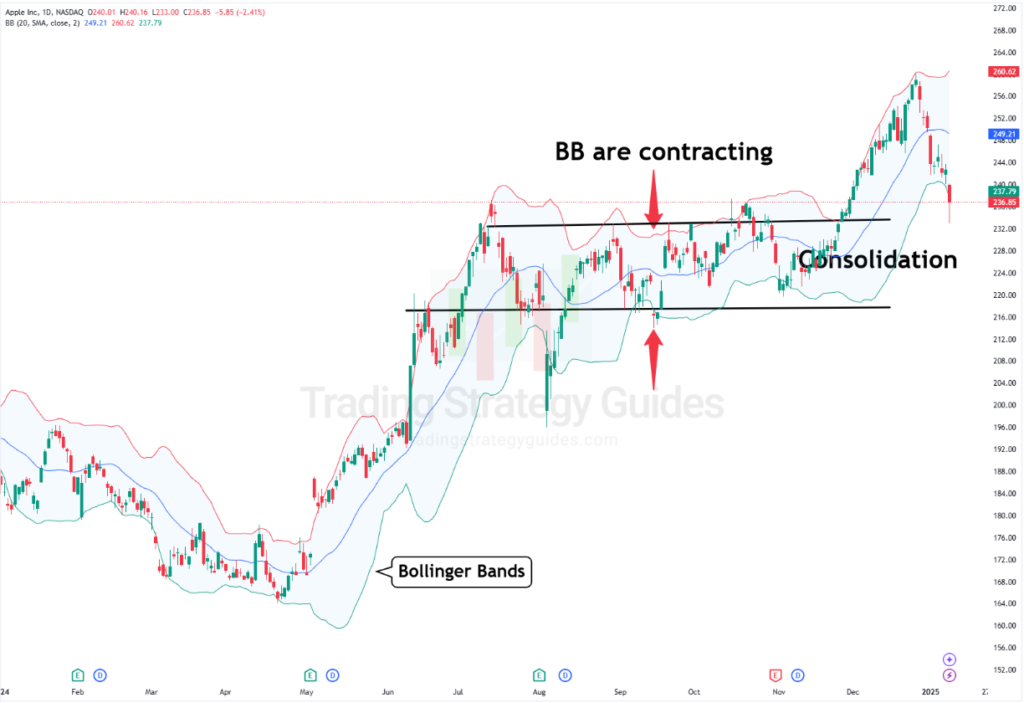
The Bollinger Bands trading indicator is a useful tool that spots low-volatility consolidation periods. When a stock moves sideways within a narrow range, the Bollinger Bands contract, indicating a potential setup for future price action. We can also use the Relative Strength Index to confirm the loss of momentum.
Another technique that works with Bollinger Bands is the squeeze method. A squeeze happens when the price has been trending strongly but then slows down and starts consolidating within a tight range.
A trader can visually recognize when a stock is consolidating because the upper and lower bands move closer together. This shows that price fluctuations have decreased. Once the consolidation ends, the stock usually breaks out sharply in one direction, ideally with strong volume.
In sideways markets, reversal trading techniques can be effective, as prices fluctuate between key levels like a bouncing ball.
We first check if the current RSI value is lower than the average volatility within the Bollinger Bands to confirm the slowdown. This suggests the stock has just entered consolidation.
Stock Consolidation Trading Strategies
Now, let’s explore some swing trading strategies to help us trade the consolidation pattern. We’re going to look at 3 different trading strategies to buy, sell or hold when the stock market is range-bound.
See below…
When to Buy in a Consolidation Phase
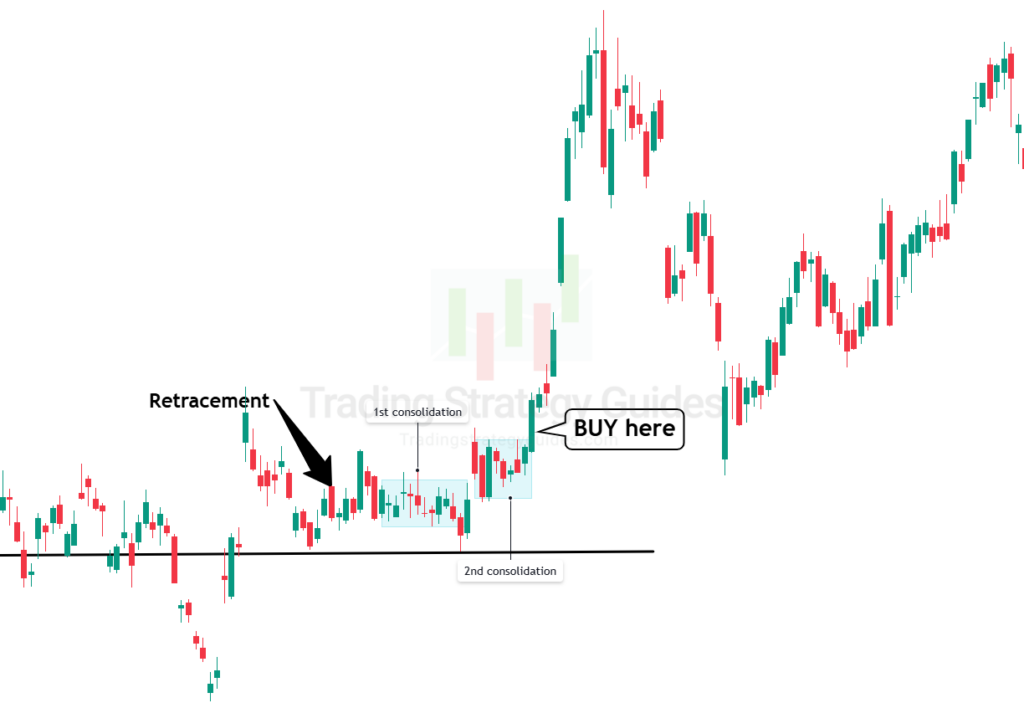
The buy trading strategy follows a less known chart pattern, namely the double consolidation pattern. This stock trading strategy comes into play when the price begins to move upward after a retracement within a broader bullish trend.
So, how does the double consolidation pattern take shape?
- First, the price moves upwards, followed by a retracement.
- Then, a consolidation forms just above key support level.
- The price breaks above this consolidation, only to form another consolidation (the second one).
- When the price breaks above the resistance of this second consolidation, a buy trade is triggered.
- Your stop loss is placed below the support of the second consolidation.
Each consolidation should last at least 4-5 days, though they may last longer. If you draw rectangles around the consolidations, they should either touch or slightly overlap, because if they’re too far apart, the power of the trading strategy weakens.
When to Sell During Consolidation
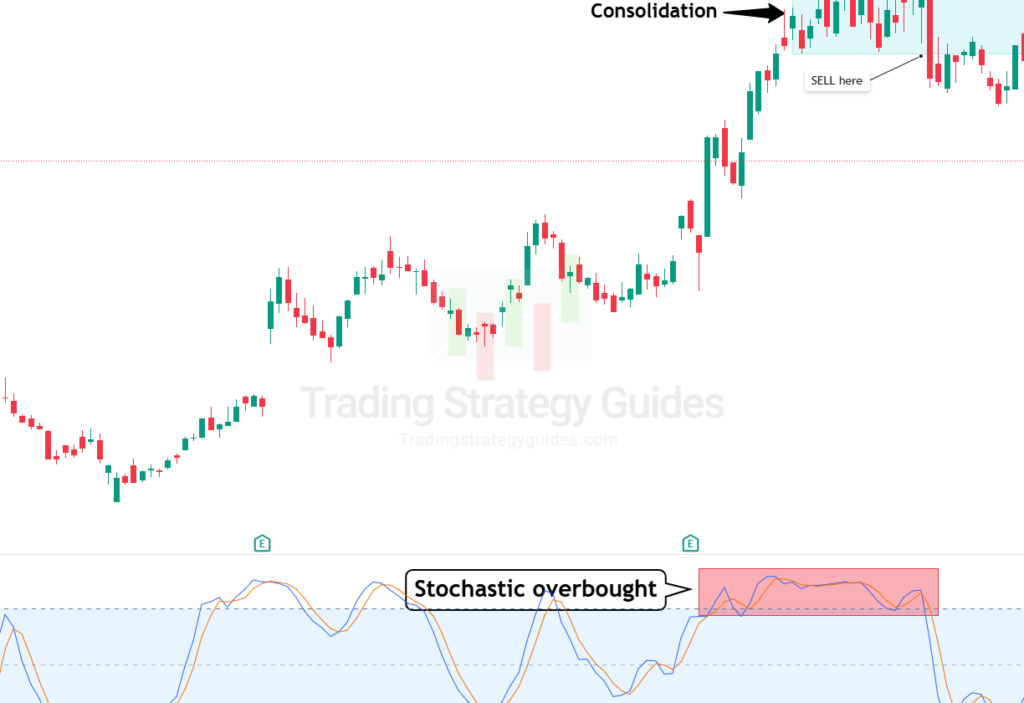
The sell trading strategy focuses on a consolidation pattern that signals a potential price reversal. It involves a stock that remains stuck in a consolidation phase while the stochastic oscillator stays in overbought territory (typically 80) throughout this entire range.
Even though the price is not breaking out, the underlying bullish momentum is weakening. The continued overbought reading despite sideways price action indicates a divergence between price and momentum, a classic warning sign of a potential trend reversal.
Execution:
- The sell trade is triggered when the stock breaks down from the consolidation range.
- Your stop loss goes just above the highest point of the consolidation.
When to Hold and Wait
This stock trading strategy emphasizes patient observation of price action within consolidation ranges to identify chart setups where holding positions is likely to be more profitable than selling. So, rather than viewing consolidation as a signal to exit, we treat it as an opportunity to accumulate during controlled price action.
Most traders see consolidation and think “Oh great, time to take a nap” or worse, “Better sell and find something more exciting.”
Big mistake!
The first step, is to determine if the current stock price is in a “healthy consolidation” or not.
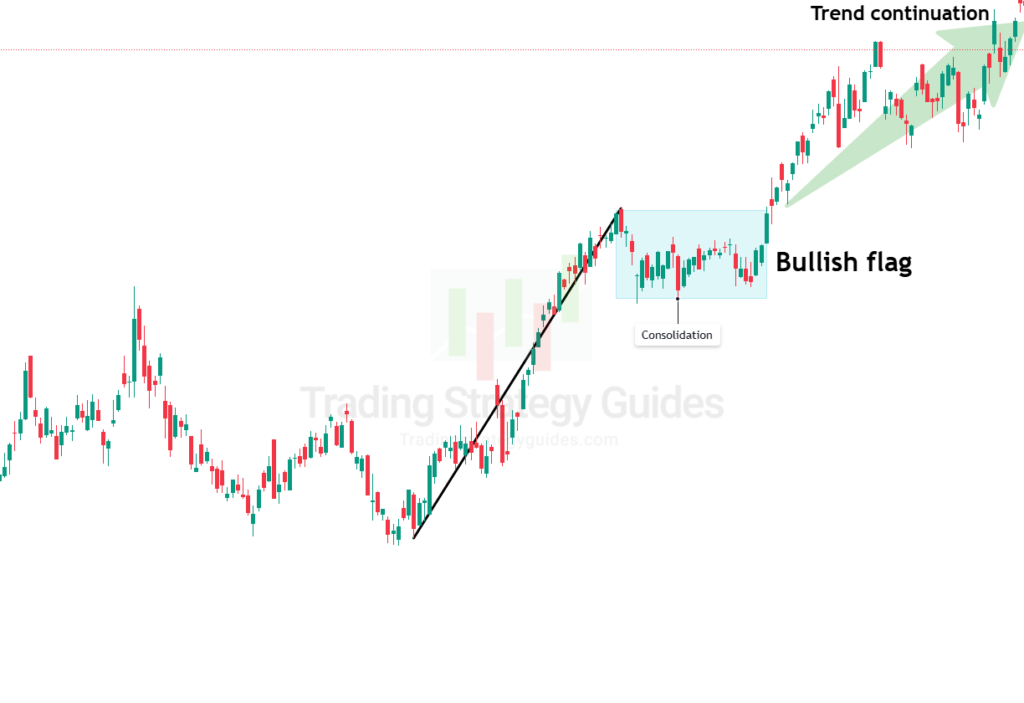
We call a stock in a “healthy consolidation” those stocks that develop bullish continuation chart patterns like flags, pennants, ascending triangle, bullish wedge, etc.
When you spot a solid continuation pattern, here’s what to do:
- Are the stock price still above major moving averages? Sweet!
- Are the dips getting smaller, price making higher lows? Even better!
- Is volume shrinking? Perfect!
These are your bullish signals to keep on holding to your stock or even better don’t be afraid to add to your position.
Let’s keep it real – not every pattern works out. Sometimes that spring-loaded move turns into a spring breakdown. Remember that the key to successful trading stock consolidation lies not just in pattern recognition, but in the ability to assess chart pattern quality and your level of experience.
Source link