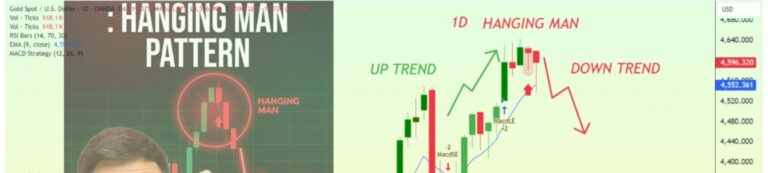
Gold Daily Analysis (19 January 2026): Hanging Man Pattern and Market Context
Gold has printed a Hanging Man candlestick on the daily timeframe following a sustained bullish move. This pattern typically appears near potential market tops and often signals buyer exhaustion, rather than an immediate trend reversal. The candle’s long lower shadow shows that sellers were able to push price significantly lower during the session. However, buyers…