Target’s Secret Weapon: How They’re Defying Retail Trends in 2024!

Get Email Alerts and Follow Us:
In March, Target Corporation projected growth for 2024, building on gains in guest engagement and sales over the past five years. By the end of Q1, Target remains on track, despite top-line performance not fully meeting expectations. The U.S. consumer has shown resilience amid rising prices and interest rates, with spending shifting back to services and entertainment. Discretionary categories like home goods remain soft, but apparel has improved. Target’s operational excellence, including a successful Diane Von Furstenberg partnership and strategic price cuts, enhances guest satisfaction. The relaunch of the Target Circle loyalty program, which added over 1 million members in Q1, and a rise in digital sales driven by same-day services, reflect Target’s adaptability. In Q1, Target generated over $24.5 billion in revenue, a 39% increase from Q1 2019, with EPS of $2.03. Looking ahead, Target aims for top-line growth starting in Q2, focusing on operational excellence and value.
U.S. Consumer Resilience
The U.S. consumer has shown remarkable resilience despite rising prices and interest rates over the last few years. Spending patterns continue to normalize as consumers shift their spending back to services and entertainment outside their homes. This shift, combined with high prices, results in continued soft trends in discretionary categories, particularly in home and hardlines. However, a meaningful improvement in discretionary trends, especially in apparel, was observed in Q1, offering optimism for a better balance in spending between discretionary and frequency categories in the future.
Operational Excellence and Innovation
Target remains focused on operational excellence and agility to respond quickly to environmental changes. The company continues to deliver newness to its guests and capitalize on seasonal moments, hallmarks of the Target brand. Highlights from Q1 include a successful limited-time partnership with designer Diane Von Furstenberg and an assortment of pickleball equipment and apparel in collaboration with the athletic brand Prince. Additionally, Target announced price cuts on 1,500 frequently shopped items, with plans for further reductions on 1,000 more items this summer to help guests stretch their budgets.
Target Circle Loyalty Program
Target relaunched its Target Circle loyalty program in April, integrating credit and debit card programs and same-day delivery capabilities under a single umbrella. With over 100 million members, Target Circle is one of the largest loyalty programs in the U.S. The relaunch has been well-received, with more than 1 million new members added in Q1. The company is committed to making sustained investments in this program to continue delivering value to its guests.
Digital Sales and Fulfillment Services
Target saw an increase in digital sales for the first time in over a year in Q1, driven by its same-day services, including Drive Up, in-store pickup, and same-day delivery. Same-day services experienced high single-digit growth, with Drive Up growing in the low teens. In Q1, Drive Up sales were more than 30 times larger than in Q1 2019. Target’s stores fulfilled nearly 98% of total sales, leveraging store assets, inventory, and teams to support fulfillment services.
Financial Performance
In Q1 2024, Target generated over $24.5 billion in revenue, representing a 39% growth compared to Q1 2019. The company delivered an EPS of $2.03, a 33% increase from 2019. While this growth is somewhat slower than the top-line growth, it reflects unique profit rate pressures that Target expects to offset over the next several years.
Future Outlook
Looking ahead to the remainder of 2024, Target aims to return to top-line growth, beginning in Q2. Despite continued uncertainty in the near term, the company remains focused on operational excellence, newness, and value. Target is poised to achieve its long-term growth vision, driven by its resilient team and strong guest engagement.
Detailed Q1 Performance
Comparable Sales and Category Performance
Comparable sales were down 3.7% in Q1, primarily due to softness in home and hardlines categories. However, beauty remained a standout category, delivering low single-digit growth. Apparel saw a nearly 4 percentage point improvement in comparable sales from Q4, driven by strong performance in young contemporary categories and successful partnerships like Diane Von Furstenberg.
Digital and Same-Day Services
Digital sales grew by 1.4%, driven by growth in same-day services and improvements in the apparel business. Drive Up, in particular, saw significant growth, with sales more than 30 times larger than Q1 2019. Target’s digital platforms continue to serve as the connective tissue across most transactions, with guests using the app for inspiration, price checks, and navigation.
Inventory and In-Stock Improvements
Target maintained appropriate inventory levels aligned with sales trends, resulting in a leaner overall inventory position and better in-stocks. The company saw a more than 3 percentage point improvement in overall in-stock position compared to the prior quarter. Improvements were also noted in specific measures, such as top item in-stock rates and seasonal program reliability.
Operational Enhancements
Target limited the number of items at self-checkout nationwide to ensure better guest experiences at both full-service and self-checkout lanes. The company also launched new drive-up services, including Starbucks items and drive-up returns, which received high satisfaction scores. The relaunch of Target Circle was supported by effective store team efforts, contributing to the addition of over 1 million new members in Q1.
Q1 Financial Results
Total sales declined by 3.2%, driven by a 3.7% decrease in comparable sales. Traffic and average transactions both declined by 1.9%. However, gross marginGross margin is a critical financial metric that plays a pivotal role in evaluating a company’s financial health and profitability. It is a percentage that indicates how efficientl… More improved by about 140 basis points, supported by favorable freight rates, cost savings, and reduced inventory shrink. Operating marginThe operating margin is a critical financial metric that measures a company’s ability to generate profit through its core operations. It provides valuable insights into a company’s… More rate increased slightly, thanks to enterprise efficiency efforts that offset investments in promotions and marketing.
Capital Deployment and Return on Investment
In Q1, Target’s capital expenditures were just under $700 million, with plans to invest $3-$4 billion for the full year. The company paid $508 million in dividends, up 2% from the previous year, and aims to continue its record of annual dividend increases. Target’s after-tax return on invested capitalReturn on Invested Capital (ROIC) is a vital financial metric that assesses a company’s efficiency in allocating capital to profitable investments. It provides valuable insights in… More (ROICReturn on Invested Capital (ROIC) is a vital financial metric that assesses a company’s efficiency in allocating capital to profitable investments. It provides valuable insights in… More) was 15.4%, up from 11.4% a year ago, with expectations for continued growth in this metric.
Expectations for Q2 and Beyond
For Q2, Target anticipates a comparable sales increase in the 0%-2% range, reflecting a cautious approach to the near-term outlook. EPS for Q2 is projected to be between $1.95 and $2.35, with full-year EPS guidance maintained at $8.60 to $9.60. The company remains confident in its ability to grow profitably in the years ahead, driven by a resilient team and strong guest engagement.
Insights
- Target’s 2024 growth projection builds on a five-year trend of gains.
- U.S. consumer resilience influences spending patterns amid economic pressures.
- Operational agility and strategic partnerships are key to Target’s success.
- The relaunch of Target Circle boosts customer engagement.
- Digital sales and same-day services are pivotal for revenue growth.
The Essence (80/20)
Core Topics:
- Financial Guidance and Performance:
- Target’s 2024 growth projection based on prior successes.
- Q1 revenue of $24.5 billion, 39% growth from 2019.
- EPS of $2.03, a 33% increase from 2019.
- Consumer Behavior:
- Resilient U.S. consumer despite economic pressures.
- Shift in spending from home goods to services and entertainment.
- Improvement in discretionary spending, especially in apparel.
- Operational Excellence:
- Successful partnerships and seasonal product offerings.
- Price cuts to enhance guest value.
- Target Circle loyalty program’s relaunch and growth.
- Digital and Same-Day Services:
- Digital sales increase, driven by same-day services.
- Growth in Drive Up services, significantly higher than in 2019.
The Action Plan – What Target Should Do
- Financial Strategy:
- Monitor and adjust financial forecasts based on Q1 performance trends.
- Focus on balancing top-line and bottom-line growth.
- Consumer Engagement:
- Enhance marketing to align with shifting consumer spending patterns.
- Expand successful apparel lines and discretionary categories.
- Operational Improvements:
- Continue strategic partnerships and seasonal offerings.
- Implement further price cuts to maintain customer loyalty.
- Digital Expansion:
- Invest in enhancing digital and same-day service capabilities.
- Promote the Target Circle loyalty program to increase membership.
Blind Spot
Potential Overlooked Details:
- Economic Volatility: Target’s projections assume stable economic conditions, but potential economic downturns or significant shifts in consumer behavior could impact performance.
- Inventory Management: Continued focus on maintaining appropriate inventory levels is crucial to avoid overstocking or stockouts, which could affect sales and margins.
- Competitive Landscape: The retail sector’s competitive nature requires constant innovation and differentiation to maintain market position.
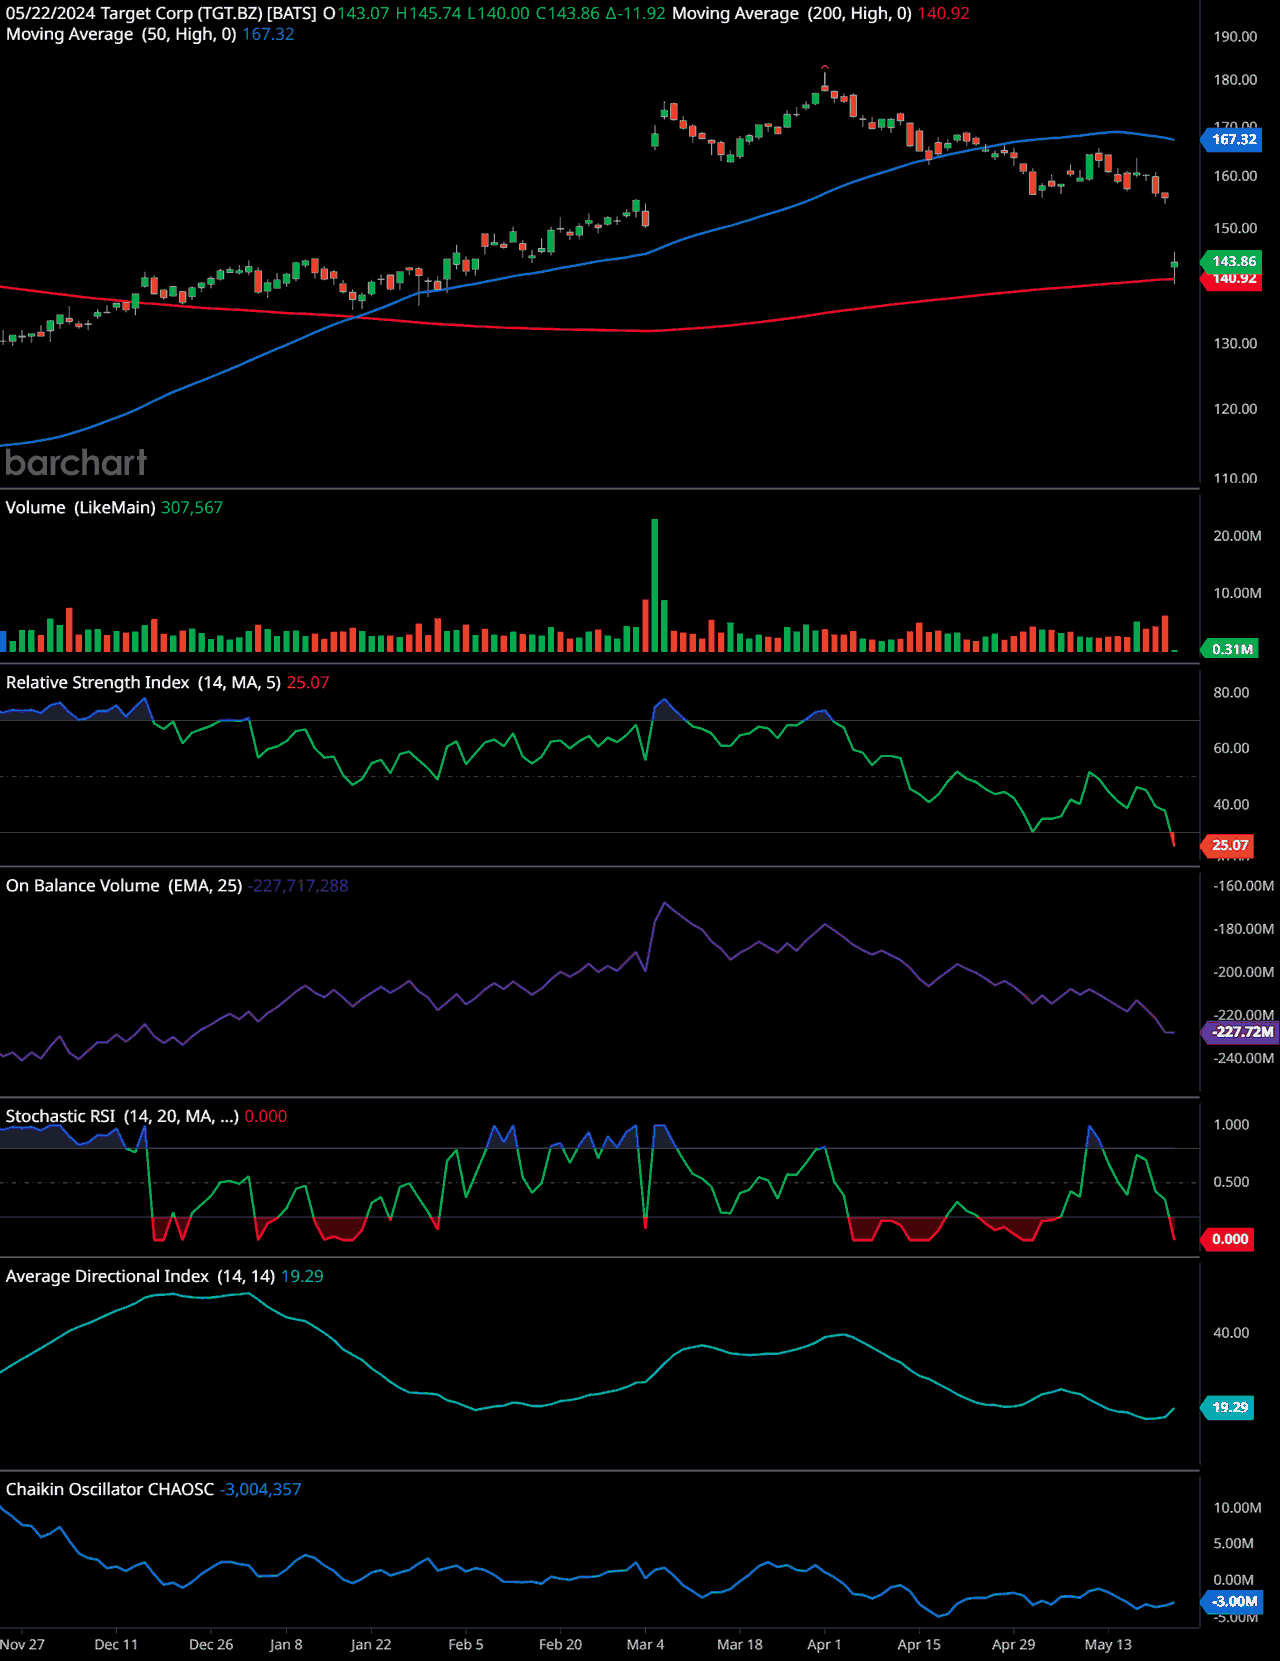
Target (TGT) Technical Analysis
Price Trend:
- Uptrend and Reversal: The stock was in an uptrend, peaking around mid-April, but has since reversed, showing a downtrend.
- Moving Averages: The 50-day moving average (blue line) is currently at 167.32, indicating a recent short-term downtrend. The 200-day moving average (red line) is at 140.92, suggesting long-term support is nearby as the current price is 143.86, slightly above the 200-day MA.
Volume Analysis:
- There was a significant spike in volume recently, indicating high trading activity which could be associated with a strong buying or selling interest.
Relative Strength IndexIn the world of technical analysis, the Relative Strength Index (RSI) stands as a cornerstone tool for traders seeking insights into market momentum. Developed by J. Welles Wilder … More (RSIIn the world of technical analysis, the Relative Strength Index (RSI) stands as a cornerstone tool for traders seeking insights into market momentum. Developed by J. Welles Wilder … More):
- The RSIIn the world of technical analysis, the Relative Strength Index (RSI) stands as a cornerstone tool for traders seeking insights into market momentum. Developed by J. Welles Wilder … More is at 25.07, which is in the oversold territory (below 30). This suggests the stock may be undervalued in the short term and could be due for a rebound.
On-Balance VolumeThe On Balance Volume indicator (OBV) is a technical analysis tool used to measure the flow of money into and out of a security over a specified period of time. It is a cumulative … More (OBVThe On Balance Volume indicator (OBV) is a technical analysis tool used to measure the flow of money into and out of a security over a specified period of time. It is a cumulative … More):
- The OBVThe On Balance Volume indicator (OBV) is a technical analysis tool used to measure the flow of money into and out of a security over a specified period of time. It is a cumulative … More has been declining, which aligns with the recent downtrend in the stock price, indicating that selling pressure outweighs buying pressure.
Stochastic RSIIn the realm of technical analysis, the Stochastic RSI (StochRSI) emerges as a powerful tool for traders seeking to navigate market dynamics with precision. Developed by Tushar S. … More:
- The Stochastic RSIIn the realm of technical analysis, the Stochastic RSI (StochRSI) emerges as a powerful tool for traders seeking to navigate market dynamics with precision. Developed by Tushar S. … More is at 0.000, indicating the stock is extremely oversold. This is another sign that a potential rebound could occur soon.
Average Directional IndexThe Average Directional Index (ADX) stands as a cornerstone indicator in the toolkit of technical traders, offering insights into the strength of market trends. Developed by Welles… More (ADXThe Average Directional Index (ADX) stands as a cornerstone indicator in the toolkit of technical traders, offering insights into the strength of market trends. Developed by Welles… More):
- The ADXThe Average Directional Index (ADX) stands as a cornerstone indicator in the toolkit of technical traders, offering insights into the strength of market trends. Developed by Welles… More is at 19.29, which is relatively low, indicating a weak trend. This means that the current trend (downtrend) is not particularly strong and could be subject to change.
Chaikin OscillatorNamed after its creator Marc Chaikin, the Chaikin Oscillator stands as a formidable tool in the arsenal of technical analysts. This oscillator is designed to measure the accumulati… More:
- The Chaikin OscillatorNamed after its creator Marc Chaikin, the Chaikin Oscillator stands as a formidable tool in the arsenal of technical analysts. This oscillator is designed to measure the accumulati… More is at -3.004,357, indicating that the money flow volume is negative, suggesting selling pressure.
Time-frame Signals:
- Short-Term (3 months): The stock is oversold with RSIIn the world of technical analysis, the Relative Strength Index (RSI) stands as a cornerstone tool for traders seeking insights into market momentum. Developed by J. Welles Wilder … More and Stochastic RSIIn the realm of technical analysis, the Stochastic RSI (StochRSI) emerges as a powerful tool for traders seeking to navigate market dynamics with precision. Developed by Tushar S. … More both indicating potential for a rebound. However, the weak ADXThe Average Directional Index (ADX) stands as a cornerstone indicator in the toolkit of technical traders, offering insights into the strength of market trends. Developed by Welles… More and negative Chaikin OscillatorNamed after its creator Marc Chaikin, the Chaikin Oscillator stands as a formidable tool in the arsenal of technical analysts. This oscillator is designed to measure the accumulati… More suggest caution. Recommendation: Hold/Watch for potential buy signals.
- Medium-Term (6 months): Considering the proximity to the 200-day moving average, there may be strong support at this level. If the price holds above the 200-day MA and shows signs of recovery, it could be a good entry point. Recommendation: Hold with a potential to buy on confirmation of support.
- Long-Term (12 months): Given the current trend and the overall decline in OBVThe On Balance Volume indicator (OBV) is a technical analysis tool used to measure the flow of money into and out of a security over a specified period of time. It is a cumulative … More, a long-term position should be approached with caution. A clear reversal signal or sustained movement above the 50-day MA would be needed for a more bullish outlook. Recommendation: Hold/Watch for trend reversal confirmation.
Overall, while the stock shows signs of being oversold in the short term, the weak trend and selling pressure suggest waiting for stronger reversal signals before making a buy decision.
Looking Ahead
Target’s Q1 results were largely in line with expectations, with positive trends in several key areas. The company remains focused on operational excellence, guest value, and innovation, positioning itself for growth in Q2 and beyond. With continued investments in stores, digital platforms, supply chain, and team development, Target is well-equipped to navigate the challenges and opportunities ahead, delivering long-term value to its shareholders and guests.
Frequently Asked Questions
1. What financial guidance did Target provide for 2024?
Target anticipated a return to growth and building on significant gains in guest engagement and top-line sales over the past five years.
2. How did U.S. consumer behavior impact Target’s Q1 performance?
Despite rising prices and interest rates, U.S. consumers showed resilience, with spending patterns normalizing towards services and entertainment outside the home. Discretionary categories remained soft, but there was meaningful improvement in apparel.
3. What were some key operational highlights for Target in Q1?
Target focused on operational excellence and agility, highlighted by a successful partnership with Diane Von Furstenberg and price cuts on 1,500 frequently shopped items. Plans for further reductions on 1,000 more items are set for the summer.
4. What changes were made to the Target Circle loyalty program?
Target relaunched its Target Circle loyalty program, integrating credit and debit card programs and same-day delivery capabilities, resulting in over 1 million new members added in Q1.
5. How did digital sales perform in Q1 2024?
Digital sales saw an increase, driven by same-day services like Drive Up and in-store pickup. Drive Up sales were particularly strong, growing more than 30 times compared to Q1 2019.
6. What were Target’s revenue and earnings in Q1 2024?
Target generated over $24.5 billion in revenue, a 39% increase from Q1 2019, and delivered an EPS of $2.03, a 33% increase from 2019.
7. What is Target’s outlook for the remainder of 2024?
Target aims to return to top-line growth starting in Q2, focusing on operational excellence, newness, and value, despite continued near-term uncertainty.
8. How did Target’s comparable sales perform in Q1?
Comparable sales were down 3.7%, mainly due to softness in home and hardlines categories. However, beauty and apparel categories showed improvement.
9. What improvements did Target see in inventory and in-stock levels?
Target maintained appropriate inventory levels, resulting in a leaner inventory position and better in-stocks, with over a 3 percentage point improvement in overall in-stock position compared to the prior quarter.
10. What are Target’s financial expectations for Q2 2024?
Target anticipates a comparable sales increase of 0%-2% and projects EPS for Q2 to be between $1.95 and $2.35. Full-year EPS guidance is maintained at $8.60 to $9.60.
Book Recommendations
- “Retail’s Seismic Shift: Strategies for Navigating Industry Change” by Michael Dart
- Provides insights on adapting to rapid changes in the retail industry.
- “Delivering Happiness: A Path to Profits, Passion, and Purpose” by Tony Hsieh
- Offers a perspective on creating a customer-centric culture and operational excellence.
- “The New Rules of Retail: Competing in the World’s Toughest Marketplace” by Robin Lewis and Michael Dart
- Explores strategies for success in the modern retail environment.
Get Email Alerts and Follow Us:
We are entirely supported by readers like you. Thank you for your support.
This content is provided for informational purposes only and does not constitute financial, investment, tax or legal advice or a recommendation to buy any security or other financial asset. The content is general in nature and does not reflect any individual’s unique personal circumstances. The above content might not be suitable for your particular circumstances. Before making any financial decisions, you should strongly consider seeking advice from your own financial or investment advisor.
Source link