Tempus AI Stock Surges on AI Health App Launch and Nancy Pelosi Investment
Tempus AI (NASDAQ: TEM), a rising player in the artificial intelligence (AI) and healthcareHealthcare stocks are shares of companies that operate in the healthcare industry. These companies provide products and services aimed at maintaining and improving health. Trading … sectors, experienced a remarkable 35.5% surge in its stock price on January 21, 2025. This dramatic increase was driven by two significant catalystsIn stock trading, a catalyst refers to an event, news, or announcement that causes a significant and often rapid price movement in a stock or the broader market. Catalysts can be p…: the launch of an AI-powered health application and a high-profile investment disclosure by former House Speaker Nancy Pelosi.
The Launch of Olivia: A Game-Changing AI Health App
Tempus AI announced the nationwide launch of Olivia, an AI-enabled personal health concierge app, signaling a pivotal moment for the company and the healthcareHealthcare stocks are shares of companies that operate in the healthcare industry. These companies provide products and services aimed at maintaining and improving health. Trading … technology industry. Designed to revolutionize how patients manage their health, Olivia offers a range of innovative features:
- Centralized Health Data: The app integrates data from over 1,000 health systems and wearable devices, creating a seamless and comprehensive health profile for users.
- AI-Driven Insights: Leveraging advanced AI capabilities, Olivia provides actionable recommendations to enhance patient outcomes and promote proactive health management.
- Wearable Integration: The app connects with popular devices such as Apple Watch and Google Fit to monitor daily health metrics.
- Clinical Support: Olivia helps users stay informed by summarizing clinical history and transcribing doctors’ appointments, empowering patients to make more informed decisions.
This groundbreaking application addresses the growing demand for AI-driven healthcareHealthcare stocks are shares of companies that operate in the healthcare industry. These companies provide products and services aimed at maintaining and improving health. Trading … solutions, positioning Tempus AI as a key player in the industry. Investors see significant potential for Olivia to disrupt traditional healthcareHealthcare stocks are shares of companies that operate in the healthcare industry. These companies provide products and services aimed at maintaining and improving health. Trading … models, making Tempus a stock to watch.
TEM Stock Trading Plan
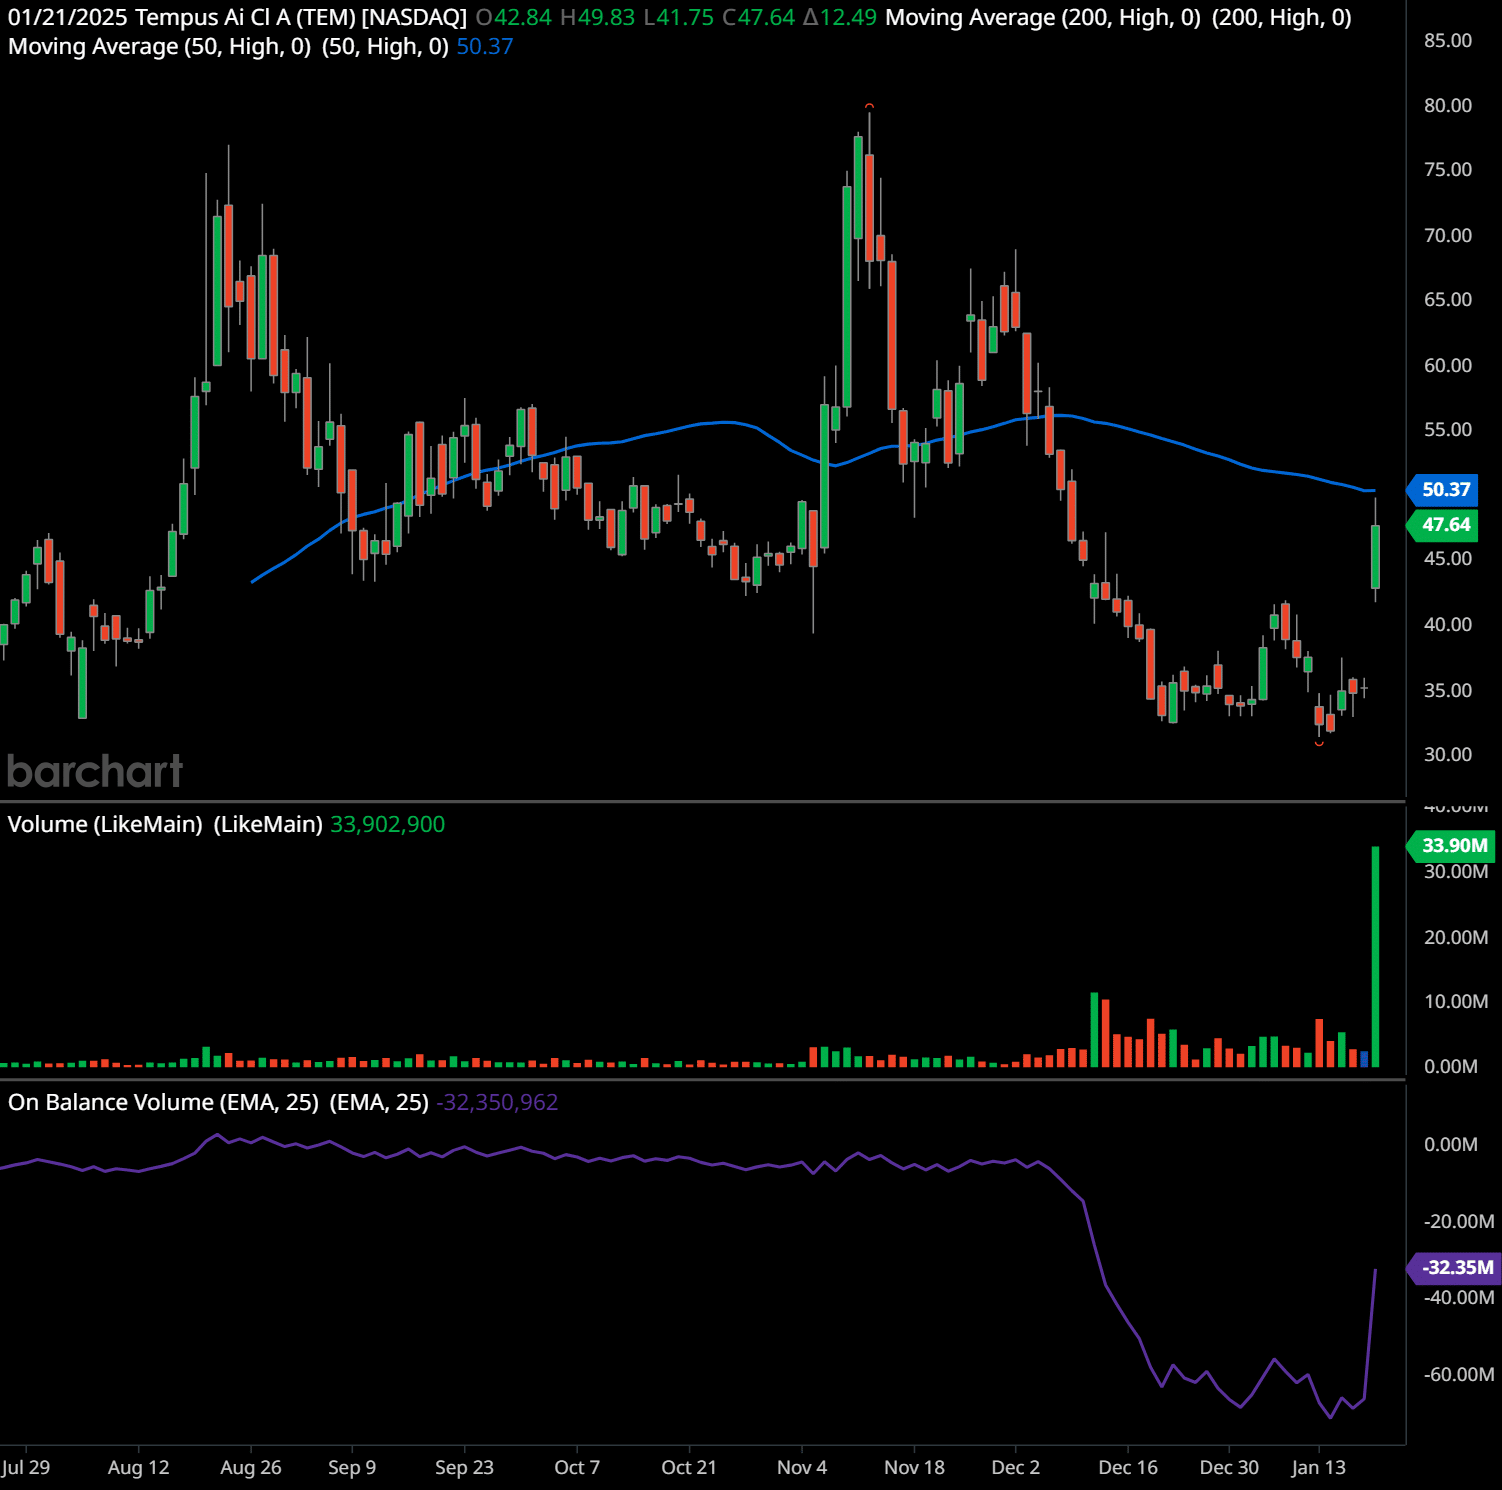
This chart of Tempus AI (TEM) on the daily timeframe reveals significant price action, indicator movements, and volume data that provide insights into future trends and trader psychologyTrader psychology refers to the emotions and mental states that influence a trader’s decision-making process in financial markets. Emotions such as fear, greed, hope, and regret …. Below is a comprehensive technical analysis:
Trend Analysis:
The stock has been in a persistent downtrend since peaking around the $80-$85 range earlier in the chart. This downtrend is characterized by a series of lower highs and lower lows, which suggests sustained bearish momentumMomentum in stock trading refers to the rate of acceleration of a stock’s price or trading volume. It indicates the strength of a trend and measures how quickly prices are rising o…. However, the recent sharp move higher, accompanied by a significant increase in volume, indicates a potential reversal or strong short-term bullish momentumMomentum in stock trading refers to the rate of acceleration of a stock’s price or trading volume. It indicates the strength of a trend and measures how quickly prices are rising o….
The price has recently closed at $47.64, above its 50-day moving averageThe concept of moving averages dates back to the early 20th century. While it is challenging to attribute the invention of moving averages to a single individual, W. P. Hamilton, a… (50.37) for the first time in a while. However, it remains below the 200-day moving averageThe concept of moving averages dates back to the early 20th century. While it is challenging to attribute the invention of moving averages to a single individual, W. P. Hamilton, a… (50.37), indicating that the longer-term trend is still bearish despite short-term bullish signals.
Support and Resistance Levels:
- Support:
- $35.00: This level represents a strong support zone where the stock consolidated before the recent breakoutBreakout patterns occur when a stock price moves beyond a defined level of support or resistance with increased volume, signaling the potential start of a new trend. A breakout ind…. Buyers stepped in aggressively here.
- $30.00: A key psychological and historical support level evident from previous price bounces.
- Resistance:
- $50.00-$50.37: The confluence of the 50-day moving averageThe concept of moving averages dates back to the early 20th century. While it is challenging to attribute the invention of moving averages to a single individual, W. P. Hamilton, a… and horizontal price resistance makes this a key level to watch.
- $55.00: A higher resistance level that may come into play if the stock sustains momentumMomentum in stock trading refers to the rate of acceleration of a stock’s price or trading volume. It indicates the strength of a trend and measures how quickly prices are rising o….
Volume and On-Balance VolumeThe On Balance Volume indicator (OBV) is a technical analysis tool used to measure the flow of money into and out of a security over a specified period of time. It is a cumulative … (OBVThe On Balance Volume indicator (OBV) is a technical analysis tool used to measure the flow of money into and out of a security over a specified period of time. It is a cumulative …):
Volume exploded to 33.9 million shares, which is significantly above the average, indicating heavy participation in the recent move. This reflects either institutional interest or heavy retail buying after a potential catalystIn stock trading, a catalyst refers to an event, news, or announcement that causes a significant and often rapid price movement in a stock or the broader market. Catalysts can be p….
The OBVThe On Balance Volume indicator (OBV) is a technical analysis tool used to measure the flow of money into and out of a security over a specified period of time. It is a cumulative …, which had been in a pronounced downtrend, spiked upward sharply, indicating that buyers are regaining control. This suggests a shift in trader psychologyTrader psychology refers to the emotions and mental states that influence a trader’s decision-making process in financial markets. Emotions such as fear, greed, hope, and regret … from pessimism to optimism, at least in the short term.
Chart PatternsChart patterns are visual formations on price charts that occur due to the behavior of buyers and sellers in the market. These patterns often signal potential future price movement… and Psychology:
The chart displays a potential double bottomThe double bottom chart pattern is a reversal pattern that indicates the exhaustion of a downward trend and the potential for an upward trend. pattern near the $35.00 level, with the recent surge possibly confirming the breakoutBreakout patterns occur when a stock price moves beyond a defined level of support or resistance with increased volume, signaling the potential start of a new trend. A breakout ind…. This pattern signifies a shift from selling exhaustion to buying momentumMomentum in stock trading refers to the rate of acceleration of a stock’s price or trading volume. It indicates the strength of a trend and measures how quickly prices are rising o…, reflecting optimism about the stock’s future prospects.
Trader psychologyTrader psychology refers to the emotions and mental states that influence a trader’s decision-making process in financial markets. Emotions such as fear, greed, hope, and regret … here likely involves short-covering (as bears close positions) and fresh buying fueled by perceived undervaluation or news.
Indicators:
- Moving AveragesThe concept of moving averages dates back to the early 20th century. While it is challenging to attribute the invention of moving averages to a single individual, W. P. Hamilton, a…:
- The 50-day MA is being tested as support, a positive sign if the stock can hold above it.
- The 200-day MA remains a ceiling, meaning bullish conviction will require breaking above this level to confirm a longer-term trend reversal.
- Volume: The massive spike suggests conviction behind the current move, often a precursor to continued bullish momentumMomentum in stock trading refers to the rate of acceleration of a stock’s price or trading volume. It indicates the strength of a trend and measures how quickly prices are rising o… in the short term.
Forecast and Future Trends:
- Short-term: The breakoutBreakout patterns occur when a stock price moves beyond a defined level of support or resistance with increased volume, signaling the potential start of a new trend. A breakout ind… above $47.00 and high volume indicate strong bullish potential in the coming days. If the stock holds above $47.00, it may test resistance at $50.00 and possibly $55.00.
- Medium-to-long-term: Sustained momentumMomentum in stock trading refers to the rate of acceleration of a stock’s price or trading volume. It indicates the strength of a trend and measures how quickly prices are rising o… will depend on the stock’s ability to break the 200-day moving averageThe concept of moving averages dates back to the early 20th century. While it is challenging to attribute the invention of moving averages to a single individual, W. P. Hamilton, a… and establish a pattern of higher highs and higher lows. Failure to do so could result in consolidation or a retracement back to $40.00 or $35.00.
Swing TradingSwing trading is a popular trading strategy aimed at capturing short- to medium-term gains by taking advantage of price swings in financial markets. Unlike day trading, which invol… Plan:
- Entry: Enter on a pullback to $45.00-$46.00 or a breakoutBreakout patterns occur when a stock price moves beyond a defined level of support or resistance with increased volume, signaling the potential start of a new trend. A breakout ind… above $50.50 (confirmed with strong volume).
- Stop Loss: Place a stop loss at $43.00 to limit downside riskIn stock and crypto trading, risk refers to the possibility of losing some or all of the capital invested in a trade. It represents the uncertainty about the future performance of ….
- Target: Take profits at $55.00 and $60.00 if momentumMomentum in stock trading refers to the rate of acceleration of a stock’s price or trading volume. It indicates the strength of a trend and measures how quickly prices are rising o… continues.
Long-Term Trading Plan:
- Entry: Accumulate in the $35.00-$40.00 range if the stock retraces, or add on a confirmed breakoutBreakout patterns occur when a stock price moves beyond a defined level of support or resistance with increased volume, signaling the potential start of a new trend. A breakout ind… above $55.00.
- Stop Loss: Place a stop at $30.00 to minimize losses if the bearish trend resumes.
- Target: Hold for a potential recovery to $65.00-$75.00 over the next 6-12 months, contingent on broader market conditions and company fundamentals.
Past performance is not an indication of future results. This analysis should not be considered investment advice. Always conduct your own research and consider consulting with a financial advisor before making any investment decisions. 🧡
Why Tempus AI Matters for Investors
Tempus AI’s innovative approach to healthcareHealthcare stocks are shares of companies that operate in the healthcare industry. These companies provide products and services aimed at maintaining and improving health. Trading … aligns with broader trends in the adoption of AI technology across industries. As healthcareHealthcare stocks are shares of companies that operate in the healthcare industry. These companies provide products and services aimed at maintaining and improving health. Trading … systems increasingly turn to digital solutions for efficiency and patient empowerment, Tempus stands out for its ability to integrate cutting-edge AI with practical, user-friendly applications. The success of Olivia could set the stage for exponential growth, making Tempus an attractive prospect for investors seeking exposure to the intersection of AI and healthcareHealthcare stocks are shares of companies that operate in the healthcare industry. These companies provide products and services aimed at maintaining and improving health. Trading ….
Pelosi’s Investment Sparks Interest
Adding to the stock’s momentumMomentum in stock trading refers to the rate of acceleration of a stock’s price or trading volume. It indicates the strength of a trend and measures how quickly prices are rising o… was a disclosure by Nancy Pelosi, former Speaker of the House, revealing a significant position in Tempus AI. According to her stock trading disclosure:
- Pelosi purchased 50 call options in Tempus AI on January 14, 2025.
- These options have a strike price of $20 and are set to expire on January 16, 2026.
- The estimated value of the calls ranges between $50,000 and $100,000.
Pelosi’s investment has drawn widespread attention, as her trades often generate market interest due to her history of strategic financial moves. Investors interpreted this move as a vote of confidence in Tempus AI’s growth potential, further fueling trading activity and enthusiasm around the stock.
Why Pelosi’s Investment Is Significant
High-profile investments can signal confidence in a company’s prospects, and Pelosi’s involvement highlights the potential upside of Tempus AI’s business model. Her track record of successful trades lends additional credibility to Tempus’s growth narrative, encouraging other investors to explore the company as a potential opportunity.
A Bright Future for Tempus AI
Since its public debut in June 2024, Tempus AI has demonstrated both volatility and promise, reflecting its status as an emerging leader in AI-driven healthcareHealthcare stocks are shares of companies that operate in the healthcare industry. These companies provide products and services aimed at maintaining and improving health. Trading …. Analysts have set a one-year price target of $56 per share, suggesting substantial upside from current levels. The combination of cutting-edge technology, growing market demand, and strategic investments positions Tempus as a compelling choice for investors.
As the healthcareHealthcare stocks are shares of companies that operate in the healthcare industry. These companies provide products and services aimed at maintaining and improving health. Trading … industry continues to embrace digital transformation, Tempus AI’s advancements in AI applications stand out as a key driver of innovation. With the launch of Olivia and the endorsement of high-profile investors, Tempus AI is well-positioned to capitalize on the growing intersection of technology and healthcareHealthcare stocks are shares of companies that operate in the healthcare industry. These companies provide products and services aimed at maintaining and improving health. Trading …. Investors seeking exposure to this transformative sector may find Tempus AI an essential addition to their portfolios.
Do you have a news tip for GuerillaStockTrading? Please email us at
[email protected]
🗨️ JOIN OUR COMMUNITY OF STOCK TRADERS AND INVESTORS ON SOCIAL MEDIA
💥 GET OUR LATEST CONTENT IN YOUR RSS FEED READER
We are entirely supported by readers like you. Thank you.🧡
At GuerillaStockTrading, we maintain full transparency and impartiality; we never blog about stocks or crypto in which we hold a personal position unless explicitly stated in the article. Additionally, we do not accept paid promotions presented as content. All information shared is for informational purposes only and should not be construed as financial, investment, tax, or legal advice, nor as a recommendation to buy any security or financial asset. The content is general in nature and does not account for individual circumstances. It may not be suitable for your particular situation. Before making financial decisions, you are encouraged to seek guidance from your own financial or investment advisor.