That 1 Special Indicator for Successful Trading – Forex Trading Forum

MACD – Moving Average Convergence Divergence
MACD is a more detailed method of using moving averages to find trading signals from price charts. Developed by Gerald Appel, the MACD plots the difference between a 26-day exponential moving average and a 12-day exponential moving average. A 9-day moving average is generally used as a trigger line, meaning when the MACD crosses below this trigger it is a bearish signal and when it crosses above it, it’s a bullish signal.
As with other studies, traders will look to MACD studies to provide early signals or divergences between market prices and a technical indicator. If the MACD turns positive and makes higher lows while prices are still tanking, this could be a strong buy signal. Conversely, if the MACD makes lower highs while prices are making new highs, this could be a strong bearish divergence and a sell signal.
Another day, another indicator. This time, we want to look at how to use the MACD indicator to see what it is all about and how it might come in handy as you are trading. If you feel that your trading is lacking some indicators and tools that might be of use to you, then you need to listen to what is being spoken about here.
There is a lot of value to be had in these indicators, and you don’t want to hobble yourself by not having them in your arsenal.
That 1 Special Indicator for Successful Trading
What is the MACD Indicator?
The MACD in the name stands for “Moving Average Convergence Divergence”. It is a mouthful to say all of that, so most people just shorten it to MACD. The purpose of this indicator is similar to the purpose of many others, and that is to help you fnd a trend out there.
After all, the majority of the money that a trader ever makes in the market comes from their ability to spot and
identify a new trend. If they can manage to pull this off consistently, then they are in great shape to do well in the markets.
That 1 Special Indicator for Successful Trading
That 1 Special Indicator for Successful Trading
How Does the MACD Indicator Break Down?
The various elements of the MACD indicator are important to know about because you don’t want to take for
granted that you know the mechanics of something that you are still learning a little about. Thus, you should be aware that the MACD indicator is made up of these:
- Faster moving average — the MACD line: This is the frst set of numbers that goes into it
- Slower moving average — the Signal Line: The second set of numbers that are used to compare against the faster set
- The difference between the two: Your fnal set of numbers seeks to measure the faster-moving average against the slower-moving one
The reason to have all three sets of numbers working at the same time is to try to show how they all compare
against one another. What we know from many other indicators, and what the MACD indicator is so great at
illustrating is that when the faster-moving averages cross over the slower-moving averages, that is usually the
sign of something big to come.
That 1 Special Indicator for Successful Trading
That 1 Special Indicator for Successful Trading
The Parameters of the MACD
The parameters for the MACD are generally set at a standard default setting that is useful for the purposes of getting helpful information out of the indicator.
The periods are set at 12, 26, and 9.
In this case, the 12 is the moving average of the last 12 bars on the chart, the 26 is the moving average of the last 26 bars on the chart, and the 9 is meant to represent the difference between those first two numbers.
When there is a big difference between the two numbers, the market is likely trending in a particular direction.
When the difference between the two starts to close, the market may be ready to shift directions itself. This could be a big signal of things to come, and it is important to pay attention when this happens.
It is very nice that the MACD gives the difference between the two indicators in such an easy-to[1]understand method. This means that you can take a quick peek at the MACD indicator to get some idea of where the market may be headed, at least in the short term.
You don’t want to rely simply on the eyeball test for determining exactly what is happening, but it is a good place to start if you are uncertain about what else you can do to figure out how to react to different price movements.
That 1 Special Indicator for Successful Trading
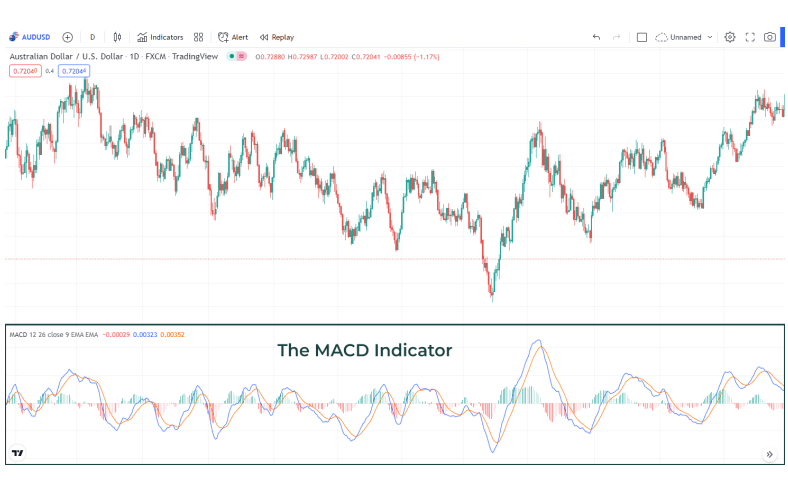
How to Use MACD Indicator
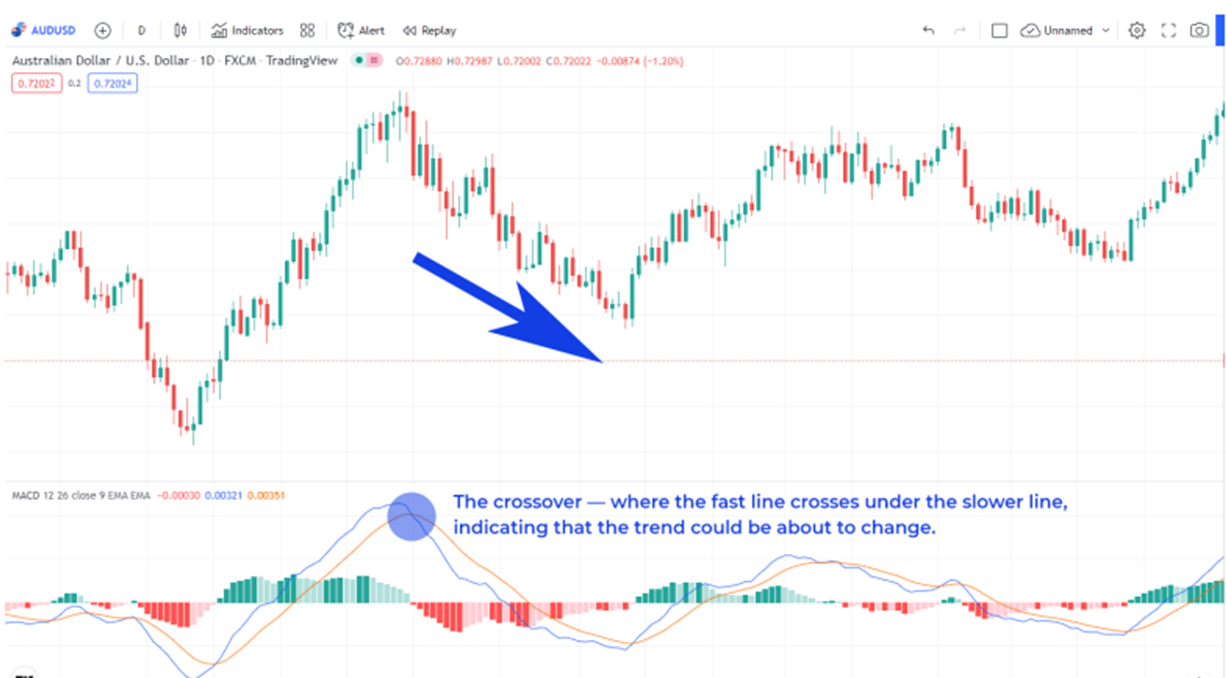
Since there are two moving averages with distinct speeds, the quicker one will understandably react faster to price movement than the slower one. When a new trend arises, the faster line — the MACD Line — will respond first and ultimately cross over the slower line — the Signal Line. When this crossover happens, and the fast line starts to “diverge” or swerve away from the slower line, it implies that a new trend may have formed.
That 1 Special Indicator for Successful Trading
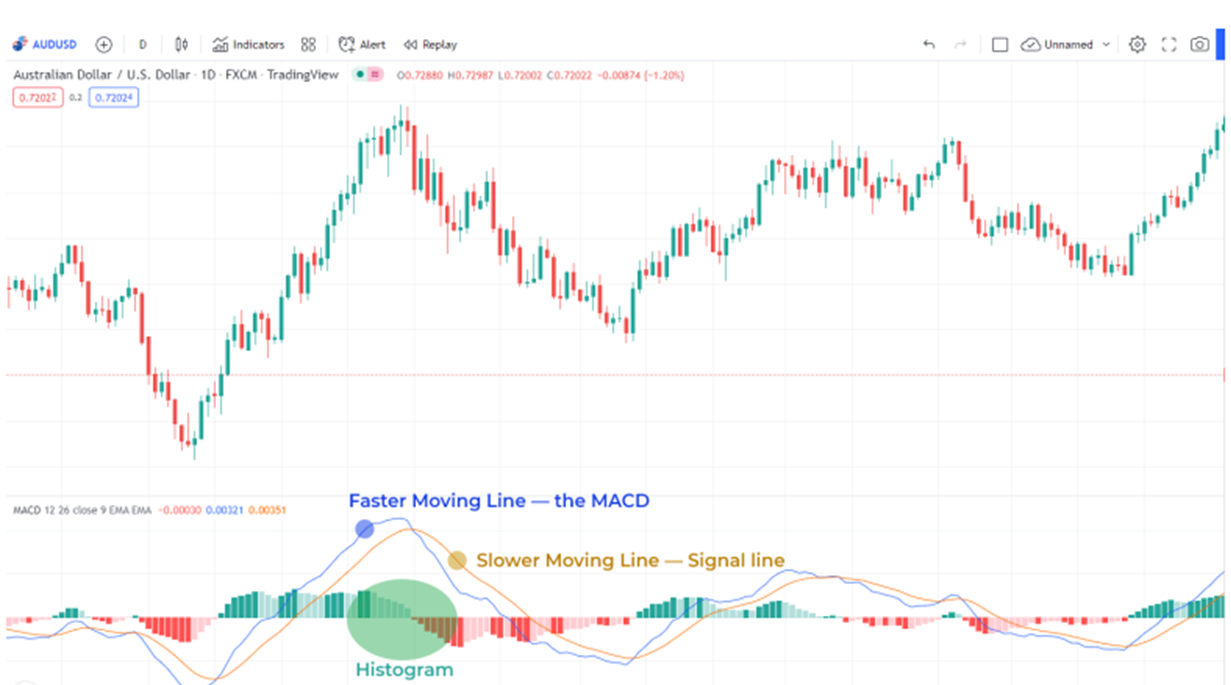
In the above chart, the fast line crossed UNDER the slow line and accurately detected a new downtrend. Note
that when the lines are crossed, the Histogram briefy vanishes since the difference between the lines at the
time of the cross is zero.
With the start of a new downtrend, the fast line deviates away from the slow line, the histogram gets larger,
which is a nice signal of a strong trend.
Keep in mind the disadvantage to MACD: Indeed, moving averages tend to LAG behind price. Thus, the MACD is a lagging indicator. After all, it’s just an average of historical prices.
That 1 Special Indicator for Successful Trading
Bear in mind the MACD indicator consists of three components:
- The MACD Line — the difference between the two moving averages.
- The Signal Line — a moving average of the MACD Line.
- The Histogram — a graphical representation of the gap between the MACD Line and Signal Line.
Do not fret if the MACD indicator takes a little while to figure out. It is a bit more complex than some of the other offerings out there, but that is because it is such a powerful tool used by so many great traders. You might find yourself wanting to use it more and more as you discover all of the power that is behind it.
Just be sure that you also combine other indicators into your trading so that you can get the fullest picture of what is going on in the markets whenever the desire to trade hits you.
That 1 Special Indicator for Successful Trading
One final word of advice:
Don’t get too caught up in the mathematics involved in putting together each study. It is much more important to understand how and why studies can and should be manipulated based on the time periods and sensitivities that you determine are ideal for the currency you are trading. These ideal levels can only be determined after applying several different parameters to each study until the charts and studies begin to reveal the “details behind the details.”
That 1 Special Indicator for Successful Trading
How to Use the MACD Indicator to Verify a Trend
Spotting the beginning of a trend is the dream of all traders. The reason is that there is nothing to be gained if you are not adept at spotting when a trend is about to begin.
Then, and only then, can you be sure that what you are seeing is something that you can potentially profit from.
Therefore, it is hardly any surprise that people are constantly on the hunt for new ways to identify when a trend is about to form. One thing that they may look at is how they can use the MACD indicator combined with an EMA crossover to spot a trend.
That 1 Special Indicator for Successful Trading
The EMA Crossover & the MACD
The MACD or “Moving Average Convergence / Divergence” indicator is a momentum oscillator used to trade trends. The crossover of the two lines gives trading signals similar to a moving average crossover system.
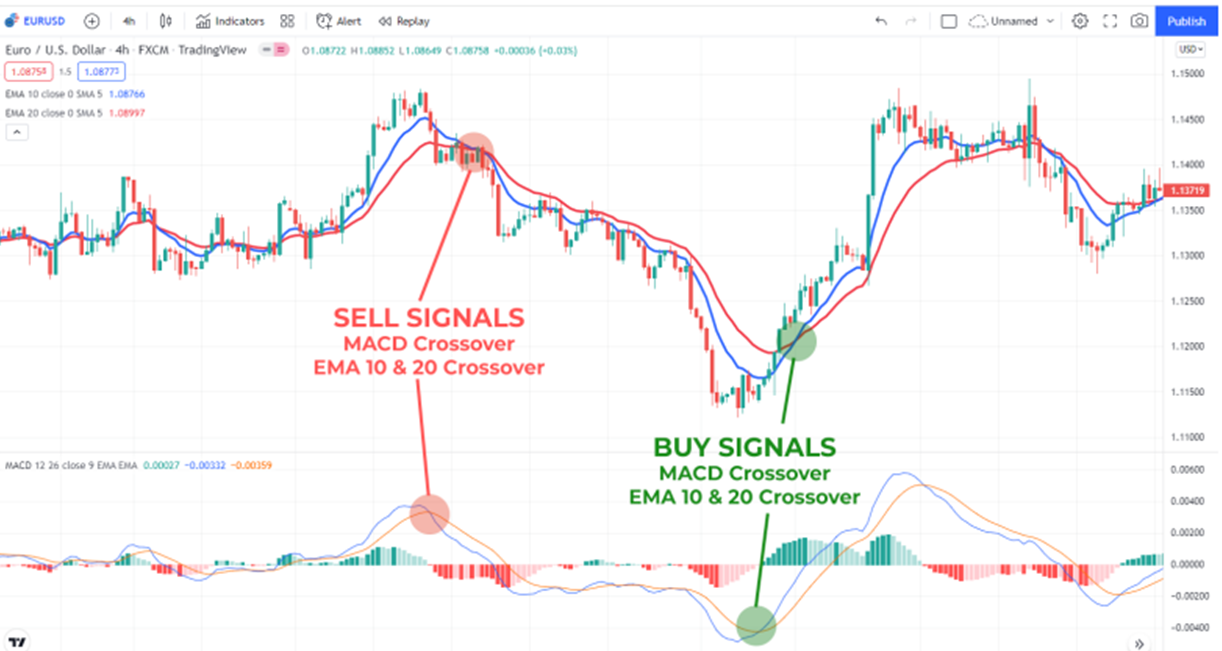
You can use the MACD signals in conjunction with two EMA lines that you compare against one another. Most of the time, these lines are set at 10 and 20 periods to make them easy to review. You just look for a time when the 10 EMA line crosses over the 20 EMA line to see when there is a bullish or bearish trend forming — and use the MACD indicator to verify the trend.
If the 10 line crosses over the 20 line in an upward direction, this is indicative of a bullish trend. If it crosses over in a downward direction, this is indicative of a bearish move.
That 1 Special Indicator for Successful Trading
Check out the chart below to find what you’re looking for:
That 1 Special Indicator for Successful Trading
That 1 Special Indicator for Successful Trading
You need to look for trends and trend reversals by looking for these MACD crossovers. They have been shown to be fairly accurate at spotting when different trends are forming, and this information may be highly useful to you as a reasonably active trader.
Thus, make sure you take the time to look at the EMA crossover and the MACD to see when a new trend may be forming. Finally, you might want to wait for a period or two after the MACD crossover to verify with the EMA crossover and ensure that you are truly seeing a new trend forming.
That 1 Special Indicator for Successful Trading
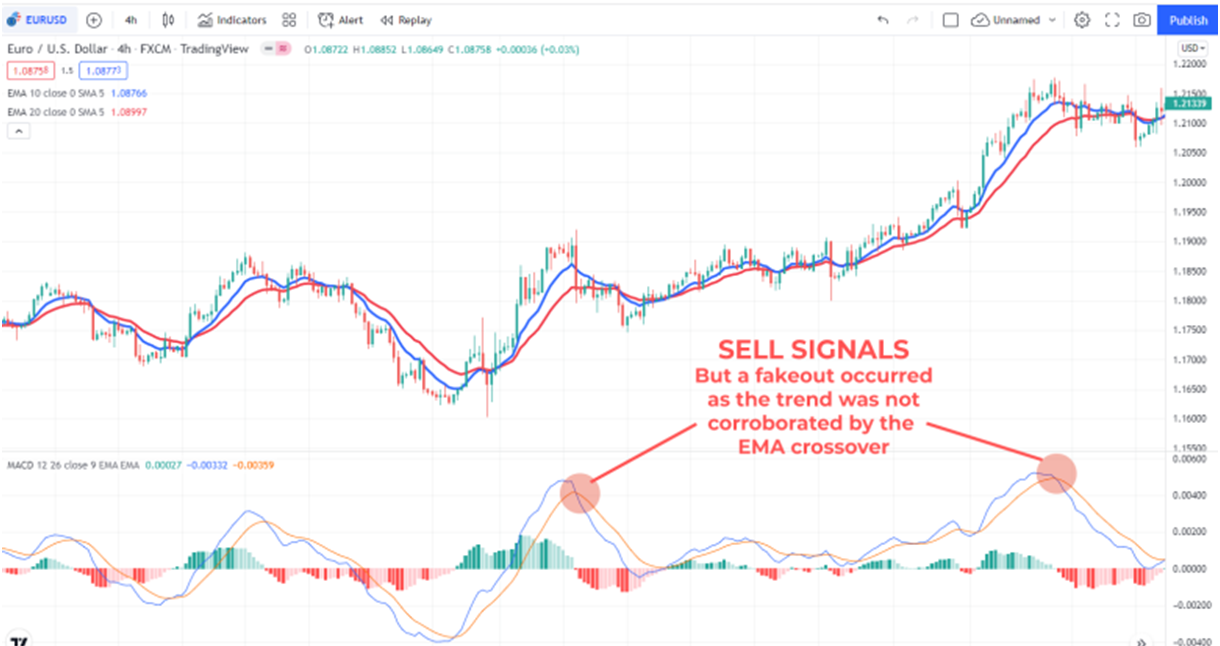
As with any indicator, fake outs can happen. This is what a fakeout may look like:
That 1 Special Indicator for Successful Trading
There is always that question : is it a real signal or is it a fake out and most of the traders are either missing the good signal or choosing the bad one.
So how to avoid being misled and be profitable ?
It is very simple – by implementing a good Risk management and keeping all your trades under the same R/R ratio .
That 1 Special Indicator for Successful Trading
Just as an example – let’s say you have 6 good trades and 4 bad ones , with R/R 1:2 ( so you risk to lose 1 to gain 2 ) you will end up by making 12 in profits and losing 4 – your end result is 8 in your favour . So if you took every single trade that system told you so, you are in a very nice profit.
Just a little bit of math and discipline tremendously increases your chances!
That 1 Special Indicator for Successful Trading
Get Your FREE Trial of The Amazing Trader – Click HERE
That 1 Special Indicator for Successful Trading
Source link