The Magic Levels Trading Pattern Strikes Again
The Magic Levels Trading Pattern Strikes Again
As I noted The Magic Levels Trading Pattern
When a currency consolidates around a magic or pivotal big figure it offers trading opportunities, both while the pattern continues and once it is broken….
…the longer the pattern goes on the greater the directional risk (trend) move once it is broken. This is the time to be on high alert as positions tend to get trimmed during this range trading period and the market has a more difficult time absorbing fresh buying or selling once the pattern is broken.
There have been two examples of the magic trading pattern and what happens when the pattern is broken.
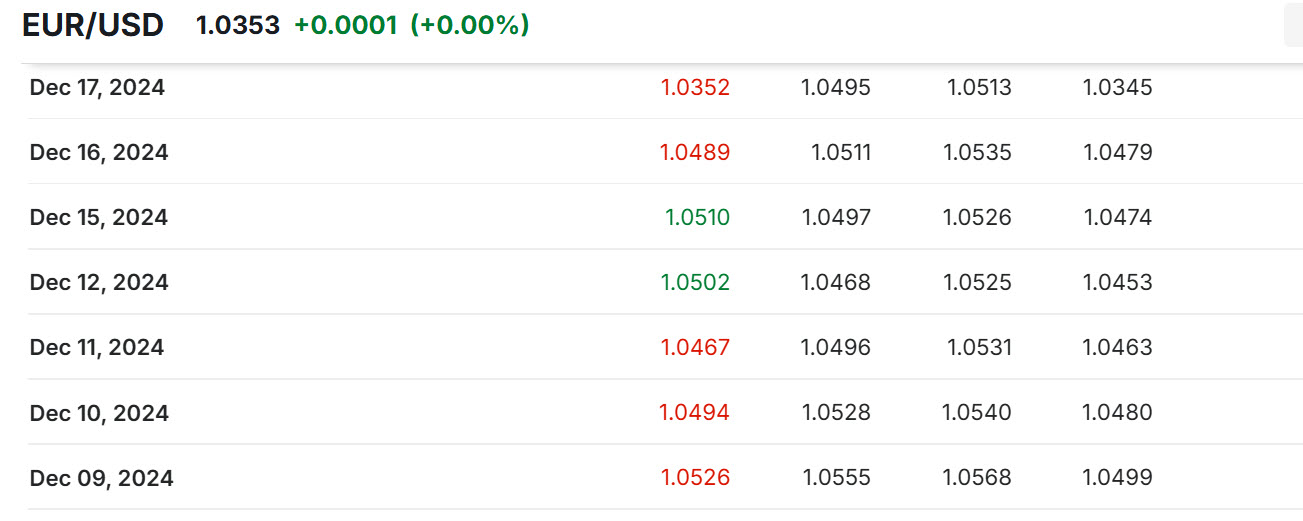
As you can see by the table below, EURUSD traded around 1.05 for 7 days in a row and on December 18, the break of 1.0453 gave a signal that the pattern would likely be broken and sent a risk or a directional move down. Scroll below to see the chart.
The following are my posts on the Forex Forum alerting readers to the evolving pattern and what to expect if broken.
From the Global-View Forex Forum:
December 16, 2024 at 9:35 am
1.05, which traded Tuesday-Friday last week, has been extended to 5 days in a row on Monday. Range is limited while this pattern continues but the longer it goes on the greater the risk of a directional move once it is broken.
December 17, 2024 at 9:52 am
Having failed to test 1.0539 (high 1.0534), EURUSD has extended its trade around 1.05 to 6 days in a now.’
The longer this pattern goes on the greater the risk of a directional move once it is broken.
December 18, 2024 at 9:01 am
EURUSD extended its trade around 1.05 to 7 days in a row… the longer it goes on the greater the risk of a directional move once it ends
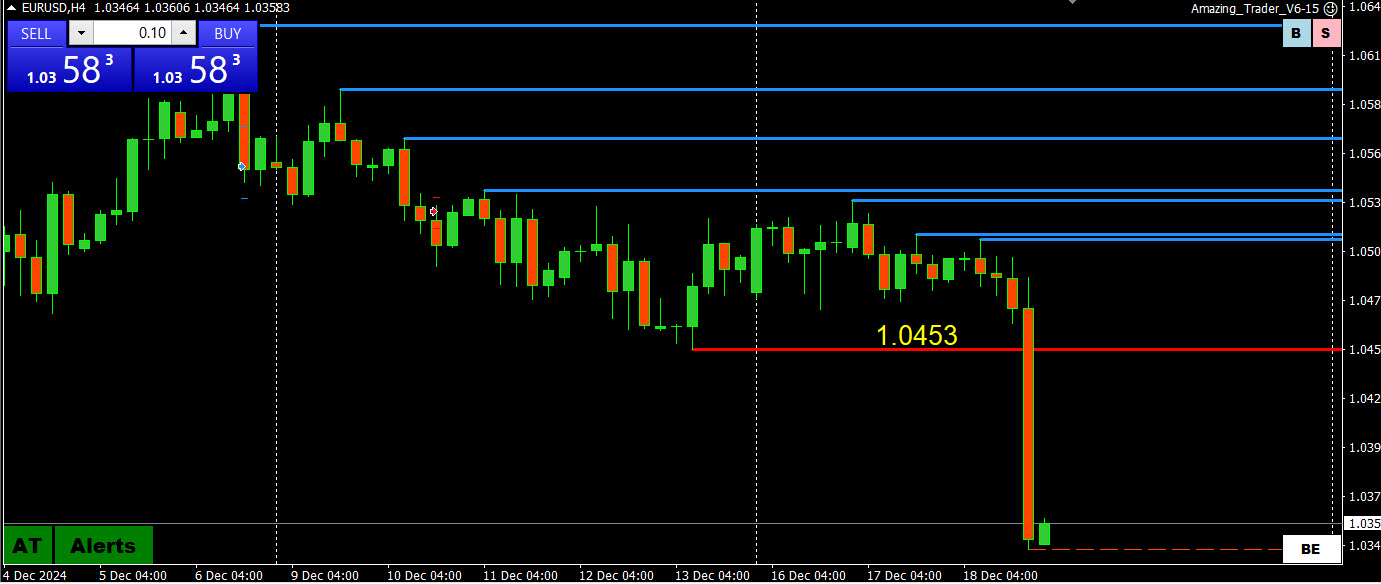
The Magic Levels Trading Pattern Strikes Again
EURUSD Directional move away from 1.05 b(4 Hour Chart)
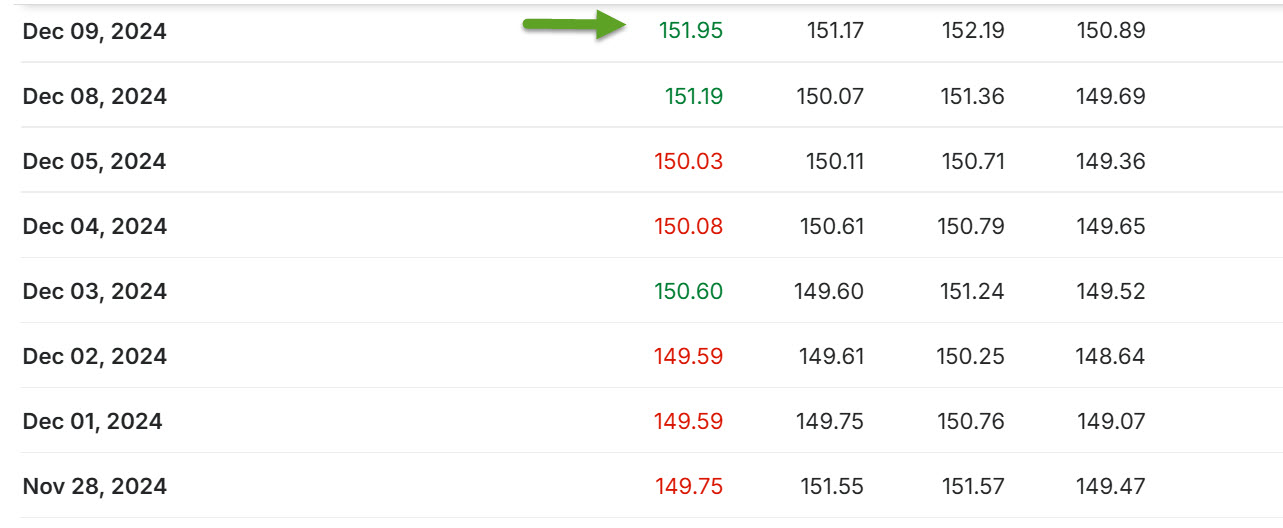
To further illustrate, this is similar to the recent USDJPY pattern around 150 and you can see by this table and from my posts on the Forex Forum what happened after that pattern was broken,
From the Global-View Forex Forum:
December 4, 2024 at 8:51 pm
150, the bias setter, has printed 3 days in a row (now 4 days) so the jury is out until the pattern breaks and it becomes support or resistance.
A break of this pattern, should it occur, would be bullish but would then need to take out 151.21 to increase the risk of a retracement.
December 5, 2024 at 10:21 am
USDJPY 150 has now traded 5 days in a row. The longer this pattern goes on the greater the risk of a directional move once it is broken.
December 6, 2024 at 10:33 am
Watch 150 as it has now traded 6 days in a row, currently above it… next directional move will be signaled by a break of this pattern
December 8, 2024 at 10:34 pm
USDJPY 150 trades for 7th day in a row
December 9, 2024 at 9:02 pm
I have been highlighting the (7-day) pattern around 150, which will likely be broken on Tuesday unless 150 trades again.
December 8, 2024 at 10:34 pm
USDJPY 150 trades for 7th day in a row
So there is some logic to a pattern you will not see in a technical analysis book but you will see highlighted on our Forex Forum.
The Magic Levels Trading Pattern Strikes Again
Get your FREE Trial of The Amazing Trader – Click HERE
Source link