Traders Are Watching This One Chart Pattern… And It Could Mean Trouble!

The MAGS ETF (Roundhill Magnificent Seven ETF) is an exchange-traded fund that offers investors concentrated exposure to the “Magnificent Seven” stocks: Alphabet, Amazon, Apple, Meta, Microsoft, Nvidia, and Tesla.
The Magnificent 7 account for approximately 33% of the S&P 500, meaning their performance heavily influences the overall market’s direction.
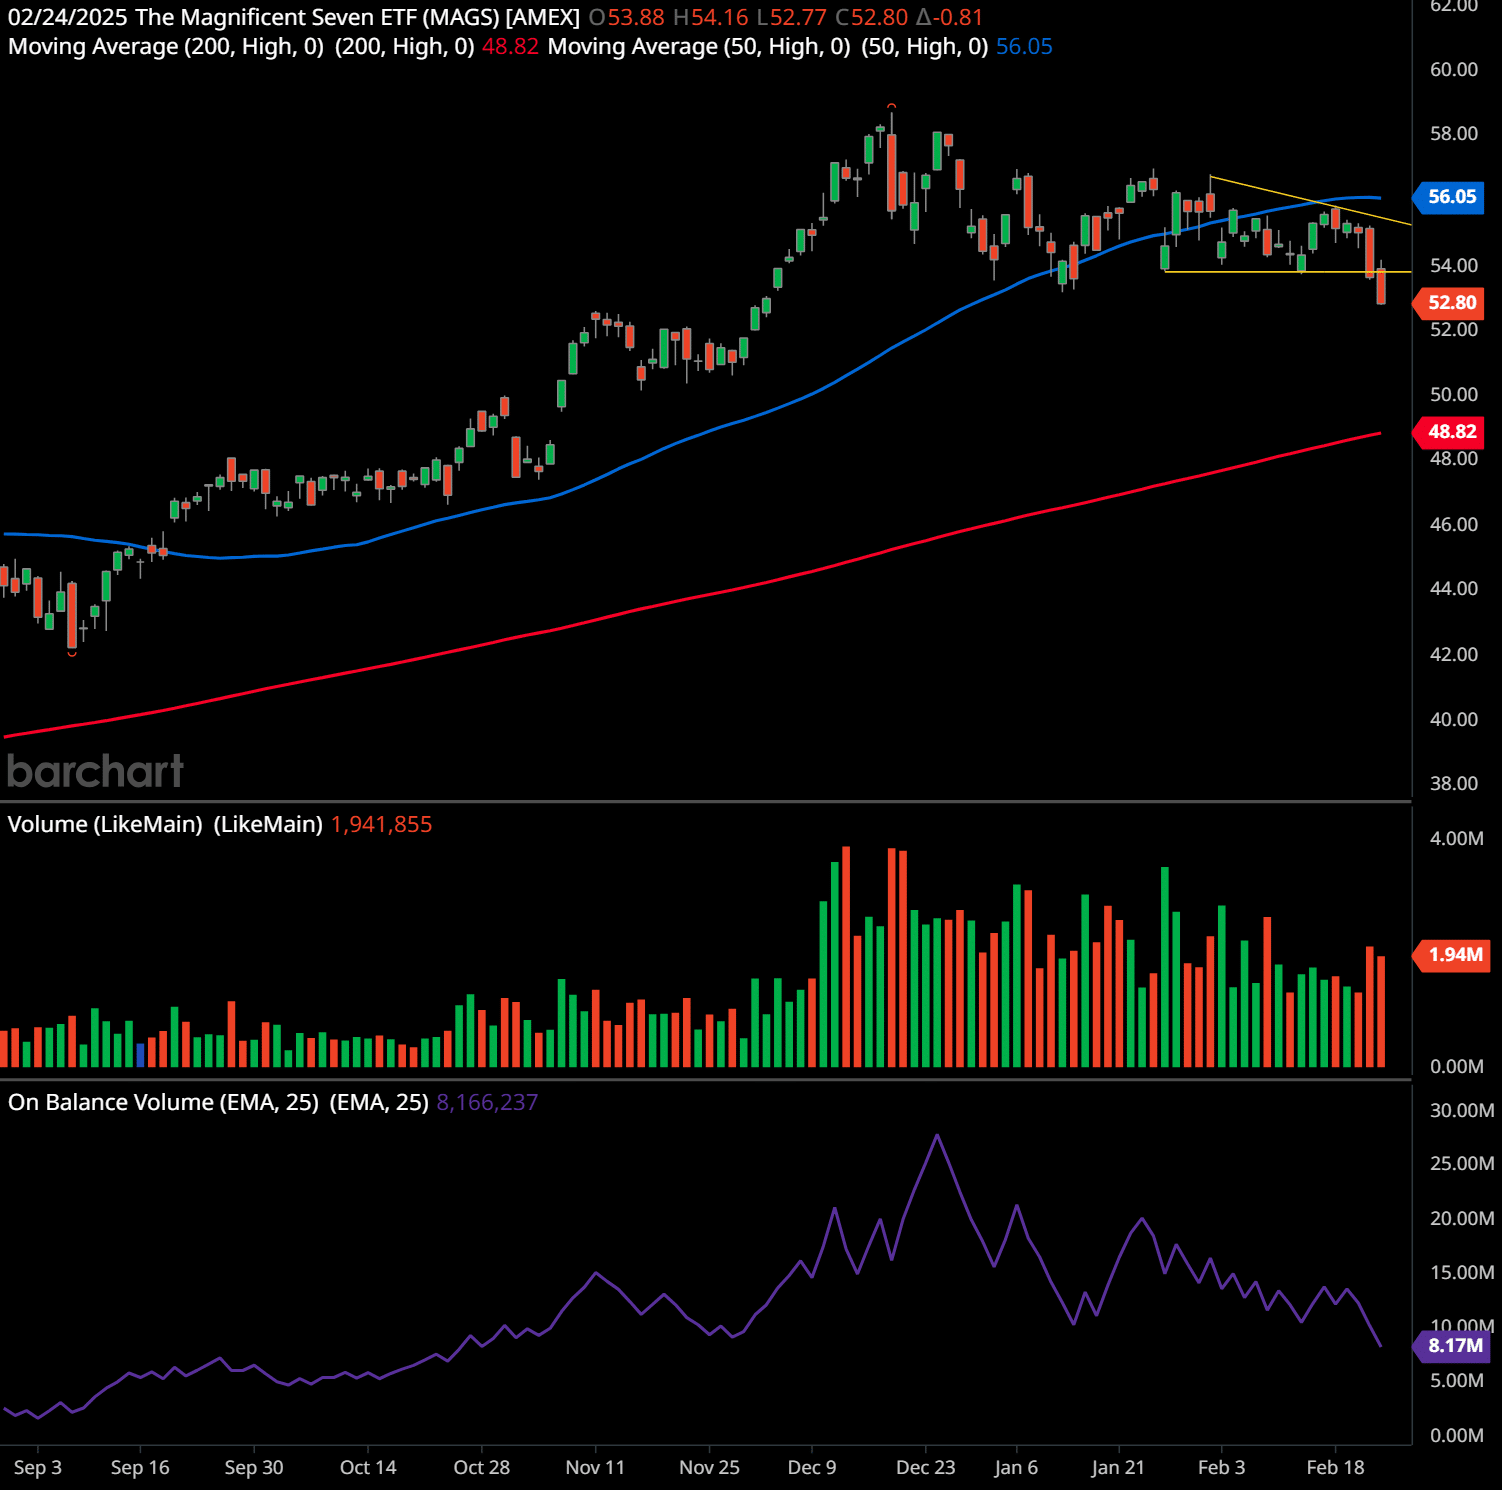
This chart of The Magnificent Seven ETF (MAGS) on a daily timeframe presents several key technical aspects that can provide insight into potential future price movements.
Support and Resistance Levels
- Support: Around $52.00-$52.80, where the price recently broke below a consolidation range.
- Resistance: Near $56.00-$56.50, where the 50-day moving averageThe concept of moving averages dates back to the early 20th century. While it is challenging to attribute the invention of moving averages to a single individual, W. P. Hamilton, a… (blue line) is currently positioned and previously acted as a support level before the breakdown.
Chart PatternsChart patterns are visual formations on price charts that occur due to the behavior of buyers and sellers in the market. These patterns often signal potential future price movement… and Their Psychology
There are two notable chart patternsChart patterns are visual formations on price charts that occur due to the behavior of buyers and sellers in the market. These patterns often signal potential future price movement…:
- Bearish PennantA pennant pattern is a continuation chart pattern that forms after a strong price movement, typically characterized by a brief period of consolidation before the price resumes its … Formation (highlighted in yellow) – This pattern formed after a down move, followed by a consolidation range. The price has broken downward from this range, suggesting continuation of the bearish trend.
- Horizontal Support Break – The stock had been consolidating within a narrow range, but the recent price action shows a breakdown, confirming a bearish sentiment.
From a psychological perspective, this indicates that buyers attempted to hold the price above $54 but failed. The breakdown likely triggered stop-loss orders, increasing selling pressure. The volume spike on the breakdown confirms stronger bearish conviction.
Trend and Indicators Interpretation
- 50-Day Moving AverageThe concept of moving averages dates back to the early 20th century. While it is challenging to attribute the invention of moving averages to a single individual, W. P. Hamilton, a… (Blue Line) Turning into Resistance: The price recently dropped below it, signaling short-term weakness.
- 200-Day Moving AverageThe concept of moving averages dates back to the early 20th century. While it is challenging to attribute the invention of moving averages to a single individual, W. P. Hamilton, a… (Red Line) as Long-Term Support: Currently at $48.82, this could be a major support if selling pressure continues.
- On-Balance VolumeThe On Balance Volume indicator (OBV) is a technical analysis tool used to measure the flow of money into and out of a security over a specified period of time. It is a cumulative … (OBVThe On Balance Volume indicator (OBV) is a technical analysis tool used to measure the flow of money into and out of a security over a specified period of time. It is a cumulative …) Declining: This suggests that money is flowing out of the stock, confirming weak buying interest.
- Volume Spike on Breakdown: Increased selling volume on the recent drop supports the idea of a stronger bearish move.
Stock Price Forecast
- Short-Term (Next Few Weeks): Bearish bias unless the price reclaims the 50-day moving averageThe concept of moving averages dates back to the early 20th century. While it is challenging to attribute the invention of moving averages to a single individual, W. P. Hamilton, a…. Potential downside target near $50-$51.
- Medium-Term (1-3 Months): If the price stabilizes near $50 and forms a base, it could attempt to recover. However, a continued downtrend could lead to a test of the 200-day moving averageThe concept of moving averages dates back to the early 20th century. While it is challenging to attribute the invention of moving averages to a single individual, W. P. Hamilton, a… around $48.80.
- Long-Term (6+ Months): If broader market sentiment improves and the ETF reclaims key levels above $56, a longer-term uptrend could resume. However, a failure to hold the 200-day moving averageThe concept of moving averages dates back to the early 20th century. While it is challenging to attribute the invention of moving averages to a single individual, W. P. Hamilton, a… would shift the trend bearish.
Trading Plans
Swing TradingSwing trading is a popular trading strategy aimed at capturing short- to medium-term gains by taking advantage of price swings in financial markets. Unlike day trading, which invol… Plan (Short-Term, 1-4 Weeks)
- Entry: Consider a short position on a retest of $53-$54 if it fails to reclaim this level. Alternatively, if price bounces near $50, a long trade could be considered.
- Stop-Loss: For a short trade, place stop above $56. For a long trade near $50, stop below $48.50.
- Target: If short, aim for $50. If long from $50, aim for $55.
Long-Term Trading Plan (6+ Months)
- Entry: Look for confirmation of support at the 200-day moving averageThe concept of moving averages dates back to the early 20th century. While it is challenging to attribute the invention of moving averages to a single individual, W. P. Hamilton, a… (~$48.80).
- Stop-Loss: Below $47 to limit downside riskIn stock and crypto trading, risk refers to the possibility of losing some or all of the capital invested in a trade. It represents the uncertainty about the future performance of ….
- Target: If the price reclaims $56 and breaks above $58, the next major upside target is $60+.
Past performance is not an indication of future results. This analysis should not be considered investment advice. Always conduct your own research and consider consulting with a financial advisor before making any investment decisions. 🧡
Investors are drawn to MAGS for its focused exposure to seven leading technology and consumer companies that are shaping the future of innovation. Rather than buying individual stocks, MAGS provides a streamlined approach to investing in these industry giants, making it an efficient investment vehicle. The ETF’s equal-weight strategy ensures that each of the seven companies is rebalanced quarterly, allowing investors to capitalize on relative value opportunities as market conditions shift.
MAGS has demonstrated strong performance, delivering an impressive one-year return of 61.65% as of January 2025, significantly outperforming the broader market. Additionally, the ETF maintains a relatively low expense ratioIn the intricate world of finance, where investment decisions can make or break portfolios, understanding the nuances of key metrics is paramount. Among these critical metrics is t… of 0.29%, making it a cost-effective option compared to other funds. Its high liquidity and low trading spreads further enhance its appeal, attracting both long-term investors and active traders looking for seamless market entry and exit.
Beyond its structural advantages, MAGS offers exposure to companies that dominate key industries such as cloud computing, e-commerce, and artificial intelligence. Investors see significant potential for continued growth, as these companies remain at the forefront of technological advancements and market leadership. By investing in MAGS, shareholders position themselves to benefit from the ongoing expansion and influence of these industry leaders in shaping the future of the global economy.
Lance Jepsen is the senior personal finance writer for Guerilla Stock Trading who has spent more than 25 years covering the stock market and economics. In addition, Lance has worked as a private stock analyst for a number of high worth individuals.
Source link