TradingView Divergence Indicator
We have talked about many technical indicators before, from the popular RSI and MACD to the more esoteric Parabolic SAR and Ichimoku Cloud – all of which are available as built-in indicators to TradingView.
Contents
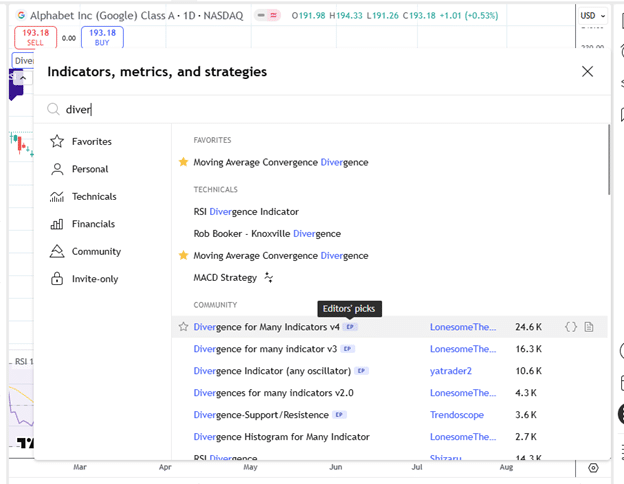
Today, we are going to talk about a third-party indicator called “Divergence for Many Indicators v4”.
As its name implies, it is going to help us spot divergences and hidden divergences on the chart.
And it does so on “many indicators” including RSI, MACD, Stochastics, Money Flow, and others.
We can tell that this is not a native TradingView indicator because we see it listed under the “Community” section when selecting the indicator:
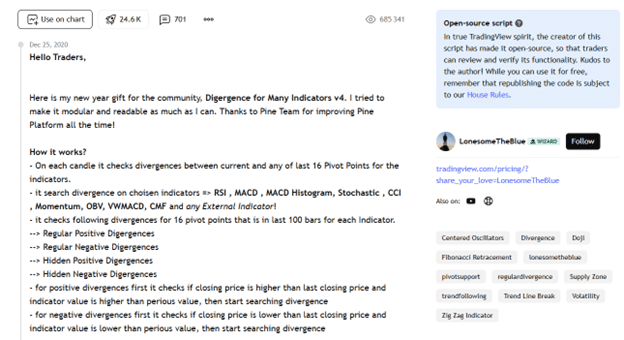
As such, this indicator is coded by someone out in the community who calls themselves LonesomeTheBlue, which you can see on the indicator’s “About Page”:
When using a publicly contributed script, we want to make sure that it is reputable and has a good number of downloads (in this case, 24.6k).
This script has decent credentials, as evidenced by its label of “Editor’s pick” next to the indicator, and the label of “Wizard” next to the author (which TradingView gives to people who have made outstanding contributions through their Pine Script coding).
The author has made the code for this indicator “open-source,” which means that anyone can freely add and use this indicator on TradingView charts, as well as see its source code.
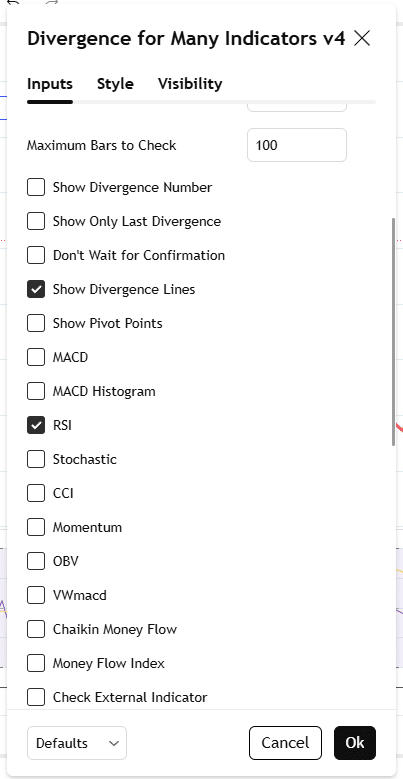
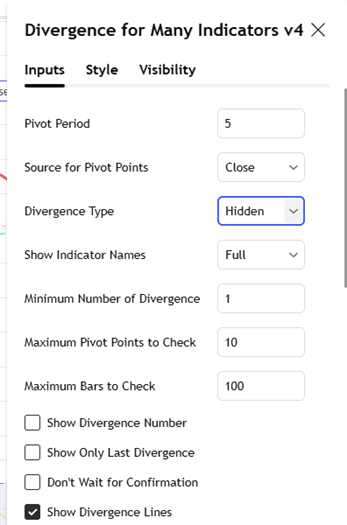
Settings For the Indicator
To begin, we will focus on looking for RSI divergences.
In the indicator settings, I will turn off the other indicators by unchecking them to avoid confusion:
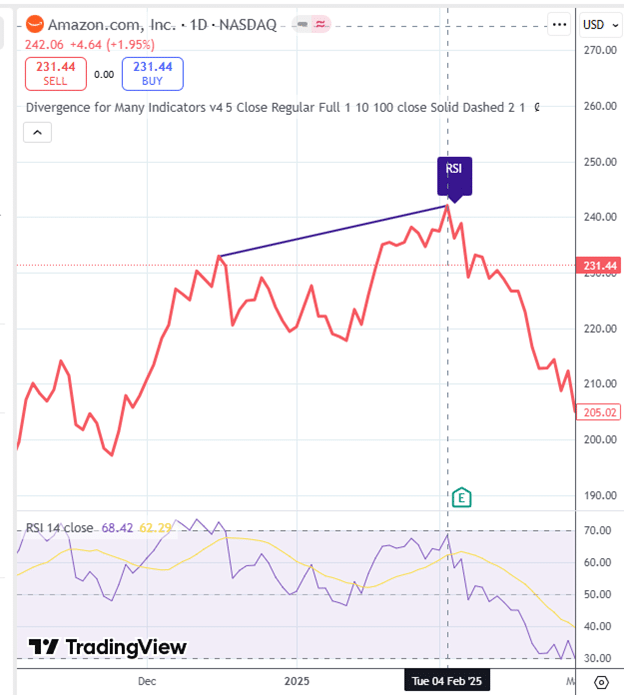
Bearish Regular Divergence
For the first example, we see that Amazon (AMZN) is in an uptrend, making higher highs in the line chart of price.
The indicator has found a bearish RSI divergence in Amazon on February 4, 2025, and has drawn the purple line connecting a high peak to a higher high peak of the AMZN price chart.
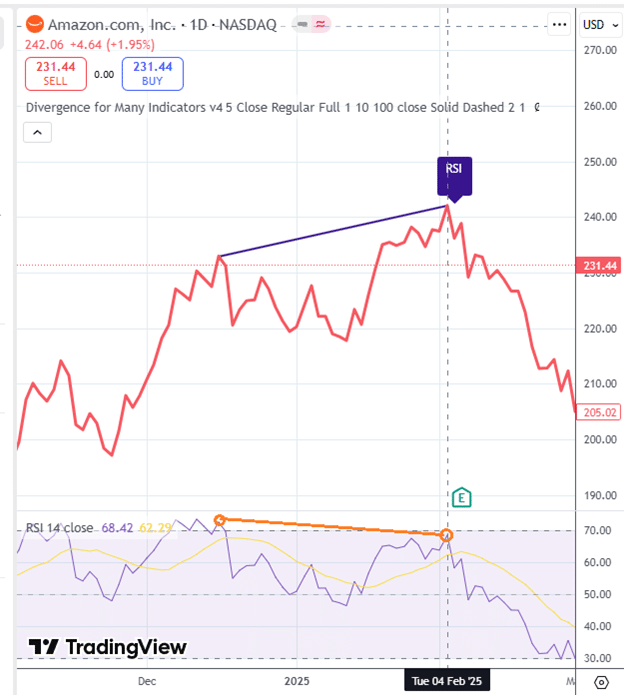
While the AMZN price has made a higher high, its RSI did not follow suit.
The RSI made a lower high, which I will highlight below with an orange line…
This is called a bearish regular divergence, not that it means that the price will reverse down.
But that might suggest that the upward price momentum may slow down to pull back, which, in this case, it did.
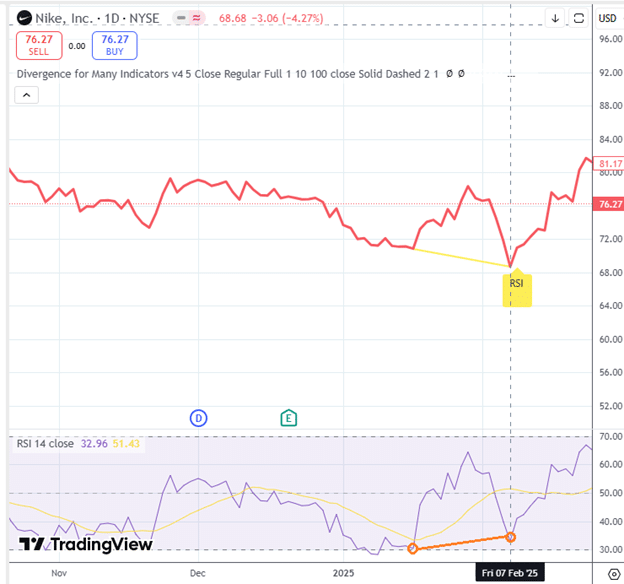
Bullish Regular Divergence
The Nike (NKE) price chart was in a downtrend in December 2024, and the sellers pushed the price even lower on February 7, 2025:
But the RSI did not confirm the move lower.
In fact, it made a higher low as I have indicated with an orange line.
This non-confirmation is a divergence. In this case, it is a bullish divergence since the lack of downward momentum shown in the RSI means a bullish possibility for the chart.
And the divergence indicator had spotted this by drawing the yellow line in the price chart.
Hidden Divergence
So far in our examples, the indicator was looking for “regular” divergences.
Now we will go into the indicator settings and ask it to look for “hidden” divergences.
Bullish Hidden Divergence
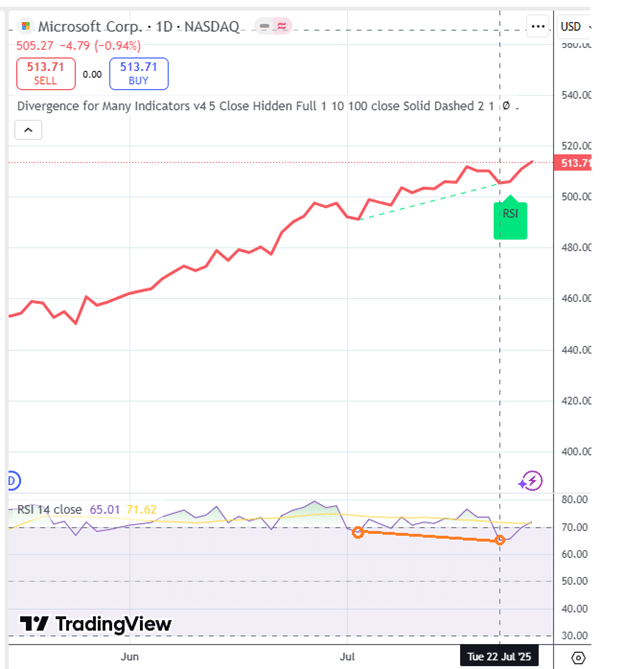
The indicator shows hidden divergences with dotted lines.
The dotted green line shown below is a bullish hidden divergence on the Microsoft (MSFT) chart, which is clearly in an uptrend:
Microsoft is in an uptrend and has made a higher low.
Typically, the RSI would follow by also making a higher low.
However, it did not (as I have drawn with the orange line).
It made a lower low instead.
This is a divergence between the price and RSI.
In this situation, it suggests that price will prevail and that the price chart will continue on its existing trend (which is bullish).
This is known as a “hidden” divergence, perhaps because it is not easy for traders to see and not easy for them to wrap their heads around.
Try to think of it this way.
Price is making a higher low despite the RSI making a lower low.
That means price is buoyed up by a hidden supportive force other than RSI momentum, implying that price should continue to rise.
It is normal for RSI to dip on pullbacks.
In this case, RSI dipped to a lower low. However, the price did not dip to a lower low.
The pullback in price is weak.
So perhaps it is a good time to buy and ride the trend continuation up.
Bearish Hidden Divergence
Maybe looking at another hidden divergence will help.
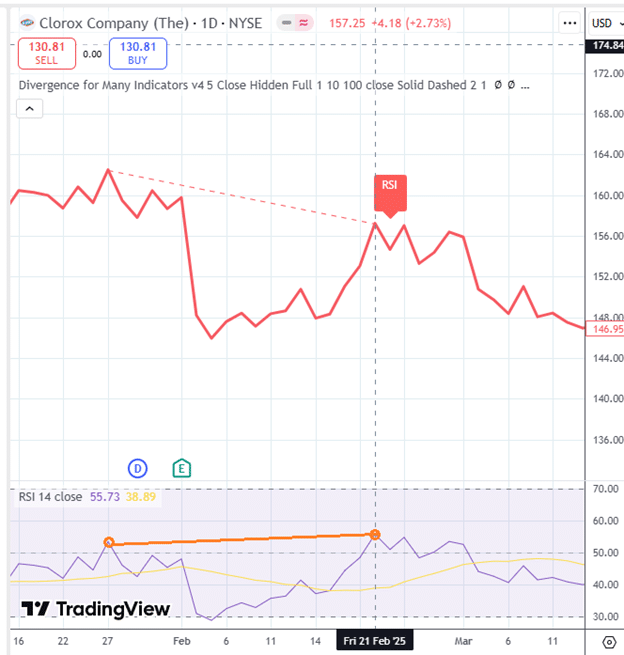
The Clorox Company stock price is in a downtrend.
This is a bearish hidden divergence in Clorox (CLX), which the indicator marked as a dotted red line on the price chart.
I have drawn the orange line in the RSI to show you that its peaks are rising while the price peaks are dropping.
A divergence.
It is a hidden divergence suggesting that the price will continue on its downtrend.
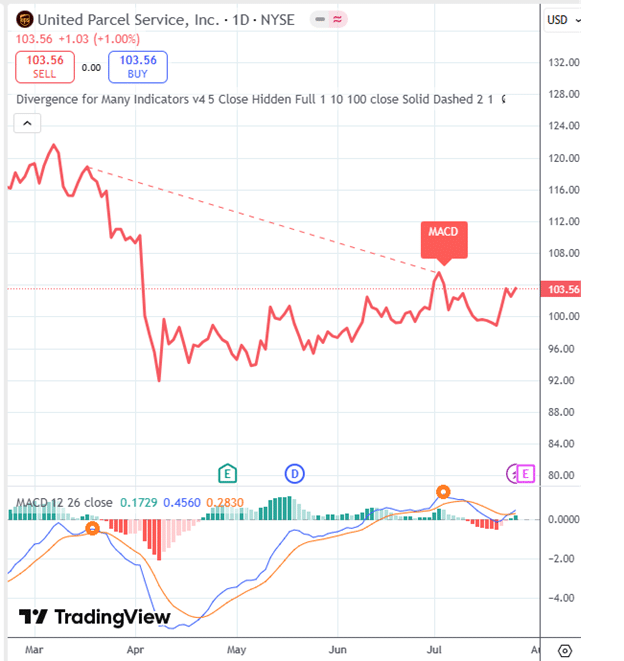
MACD Divergence
Divergences can happen on the RSI indicator or other technical indicators.
Here is a bearish hidden divergence with MACD, suggesting that the price should continue down:
Frequently Asked Questions
How to know to connect peaks or valleys when looking for divergences?
Whenever we connect peaks in the price chart, we connect peaks in the RSI.
When we connect valleys in price, we connect valleys in the indicator.
When the price chart is in an uptrend, we connect peaks to see how strong the buyers are.
If price is making a higher high, but RSI is not, then this is a regular divergence, suggesting that the uptrend may slow.
When the price chart is in a downtrend, we connect the valleys to see how strong the sellers are.
If price is making lower lows, but the indicator is not, then this is a regular divergence suggesting that the downtrend may slow or reverse (at least temporarily).
To find hidden divergences, we connect the valleys in an uptrend to see how strong the counter-trends are.
If there is a divergence, that means the uptrend should continue because the price is continuing to make higher lows even when the indicator is making a lower low.
To find hidden divergences in a downtrend, we connect the peaks to see how strong the counter-rallies are.
If the peaks are making a lower low, the downtrend should continue even if RSI is making a higher low (divergence).
Is it possible to search both regular and hidden divergences at the same time?
Yes, set the “Divergence Type” to “regular/hidden” in the indicator settings.
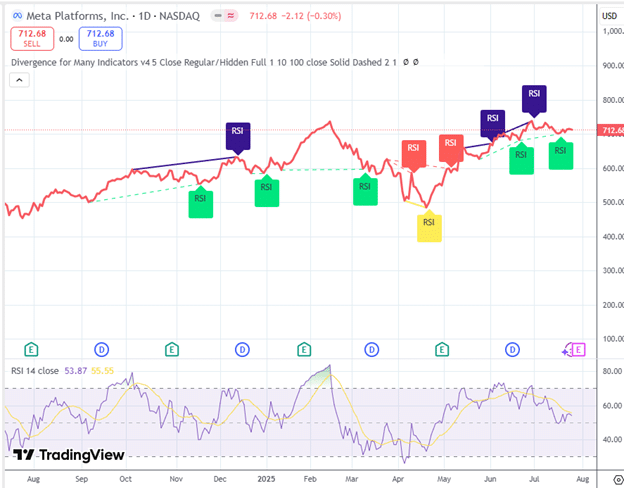
Below, we see regular divergences in solid lines and hidden divergences in dotted lines:
When the indicator connects valleys, it suggests a bullish movement in price.
When the indicator connects peaks, the divergence suggests a bearish movement in price.
As you can see, the price does not always do what the divergence suggests.
A solid line (regular divergence) suggests a price movement counter to the existing trend.
A dotted line (hidden divergence) suggests a price movement continuing the existing trend.
Conclusion
Looking for divergence is a tedious task.
The divergence indicator can make spotting them much easier.
We hope you enjoyed this article on the TradingView divergence indicator.
If you have any questions, send an email or leave a comment below.
Trade safe!
Disclaimer: The information above is for educational purposes only and should not be treated as investment advice. The strategy presented would not be suitable for investors who are not familiar with exchange traded options. Any readers interested in this strategy should do their own research and seek advice from a licensed financial adviser.

Source link